BML 7.99 Increased By ▲ 0.27 (3.5%)
BOP 27.80 Increased By ▲ 1.54 (5.86%)
CNERGY 8.05 Decreased By ▼ -0.07 (-0.86%)
CPHL 96.77 Decreased By ▼ -0.11 (-0.11%)
DCL 15.48 Increased By ▲ 0.33 (2.18%)
DGKC 246.51 Increased By ▲ 1.93 (0.79%)
FCCL 59.30 Decreased By ▼ -0.83 (-1.38%)
FFL 21.66 Decreased By ▼ -0.07 (-0.32%)
GCIL 34.00 Decreased By ▼ -0.12 (-0.35%)
HUBC 213.66 Increased By ▲ 6.99 (3.38%)
KEL 5.79 Increased By ▲ 0.03 (0.52%)
KOSM 7.62 Decreased By ▼ -0.15 (-1.93%)
LOTCHEM 26.11 Increased By ▲ 0.20 (0.77%)
MLCF 107.74 Increased By ▲ 0.21 (0.2%)
NBP 187.99 Decreased By ▼ -1.07 (-0.57%)
PAEL 55.19 Increased By ▲ 0.05 (0.09%)
PIAHCLA 21.16 Increased By ▲ 0.01 (0.05%)
PIBTL 13.75 Decreased By ▼ -0.10 (-0.72%)
POWER 18.69 Increased By ▲ 0.01 (0.05%)
PPL 190.40 Decreased By ▼ -0.69 (-0.36%)
PREMA 52.94 Increased By ▲ 4.81 (9.99%)
PRL 35.55 Decreased By ▼ -0.51 (-1.41%)
PTC 26.90 Increased By ▲ 1.01 (3.9%)
SNGP 133.01 Decreased By ▼ -0.39 (-0.29%)
SSGC 44.20 Decreased By ▼ -0.12 (-0.27%)
TELE 9.34 Decreased By ▼ -0.22 (-2.3%)
TPLP 11.31 Decreased By ▼ -0.29 (-2.5%)
TREET 26.50 Decreased By ▼ -0.06 (-0.23%)
TRG 78.97 Decreased By ▼ -0.73 (-0.92%)
WTL 1.66 Decreased By ▼ -0.02 (-1.19%)
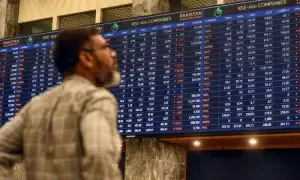
BR100 16,405 Increased By 92.5 (0.57%)
BR30 52,938 Increased By 579.1 (1.11%)
KSE100 158,781 Increased By 743.5 (0.47%)
KSE30 48,500 Increased By 249 (0.52%)

Sterling hit an 8-month low against the euro on Monday, as contrasting manufacturing growth data in Britain and in the eurozone reinforced the diverging rate outlooks that have recently kept the pound under pressure.
While Britain's manufacturing sector expanded at its weakest pace in seven months in March, manufacturing in the eurozone grew at its fastest pace in more than five years.
Sterling also traded at a three-week low against the dollar, as the Bank of England looked set to keep rates on hold at 4.5 percent at a time when both the European and US central banks have signalled further credit tightening to come.
By 1422 GMT, sterling was at 69.81 pence per euro, just off an 8-month low of 69.89 pence hit earlier. A break beyond 69.90 would take the pound to a one-year low against the single currency.
Against the dollar, sterling was down around half a percent at $1.7295, having hit a three-week low at $1.7252. A break below $1.7228 would make way for a three-month low.
"More relevant issues (for sterling) are how strong growth is elsewhere in Europe in particular and what signals we get about ECB rate hikes, if at all," said Tim Fox, currency strategist at Dresdner Kleinwort Wasserstein.

Copyright Reuters, 2006

Comments

Comments are closed.