AIRLINK 183.77 Increased By ▲ 6.32 (3.56%)
BOP 11.26 Increased By ▲ 0.15 (1.35%)
CNERGY 8.53 Increased By ▲ 0.02 (0.24%)
CPHL 96.44 Increased By ▲ 0.20 (0.21%)
FCCL 46.17 Increased By ▲ 1.19 (2.65%)
FFL 15.75 Decreased By ▼ -0.16 (-1.01%)
FLYNG 28.36 Increased By ▲ 0.45 (1.61%)
HUBC 143.44 Increased By ▲ 1.56 (1.1%)
HUMNL 13.00 Increased By ▲ 0.01 (0.08%)
KEL 4.44 Increased By ▲ 0.01 (0.23%)
KOSM 5.77 Decreased By ▼ -0.10 (-1.7%)
MLCF 64.57 Increased By ▲ 3.81 (6.27%)
OGDC 214.08 Increased By ▲ 2.38 (1.12%)
PACE 5.97 Increased By ▲ 0.21 (3.65%)
PAEL 47.02 Increased By ▲ 0.53 (1.14%)
PIAHCLA 17.09 Decreased By ▼ -0.44 (-2.51%)
PIBTL 10.43 Decreased By ▼ -0.06 (-0.57%)
POWER 12.12 Increased By ▲ 0.28 (2.36%)
PPL 171.74 Increased By ▲ 2.06 (1.21%)
PRL 34.52 Increased By ▲ 0.01 (0.03%)
PTC 22.39 Decreased By ▼ -0.23 (-1.02%)
SEARL 92.91 Decreased By ▼ -1.10 (-1.17%)
SSGC 40.83 Increased By ▲ 1.06 (2.67%)
SYM 14.20 Increased By ▲ 0.02 (0.14%)
TELE 7.28 Decreased By ▼ -0.04 (-0.55%)
TPLP 10.01 Decreased By ▼ -0.01 (-0.1%)
TRG 66.65 Increased By ▲ 0.69 (1.05%)
WAVESAPP 10.13 Decreased By ▼ -0.19 (-1.84%)
WTL 1.32 No Change ▼ 0.00 (0%)
YOUW 3.79 Decreased By ▼ -0.01 (-0.26%)
BR100 12,516 Increased By 159.7 (1.29%)
BR30 37,952 Increased By 532.7 (1.42%)
KSE100 116,901 Increased By 881 (0.76%)
KSE30 35,933 Increased By 326.2 (0.92%)
Life & Style

Karachi ranked among the worst liveable cities

In a recent survey performed by the Economist Intelligence Unit (EIU) — the research and analysis division of The Ec
Published August 21, 2017 Updated September 11, 2017

In a recent survey performed by the Economist Intelligence Unit (EIU) — the research and analysis division of The Economist Group, Karachi has been ranked lowest amongst the least habitable cities in the world.

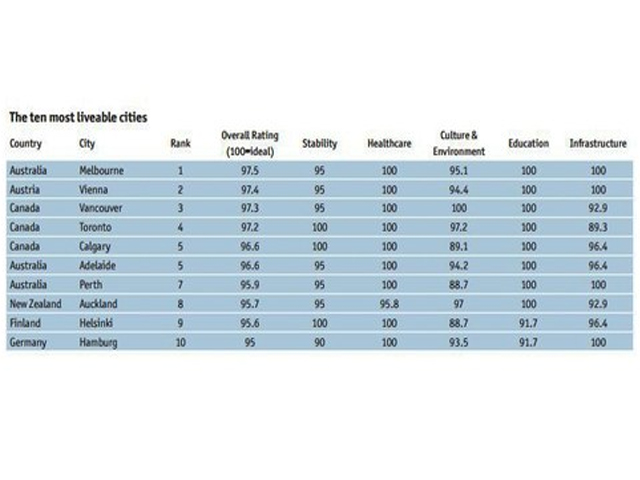
The ‘City of Lights’, Karachi scored the 134th position consecutively for the second time in the listing of the 140 cities, barely staying above cities like Port Moresby, Dhaka, Tripoli, Lagos and Damascus. While Karachi is declared as the sixth worst city to live in, Melbourne stays at the 1st position of best liveable city in the same research.

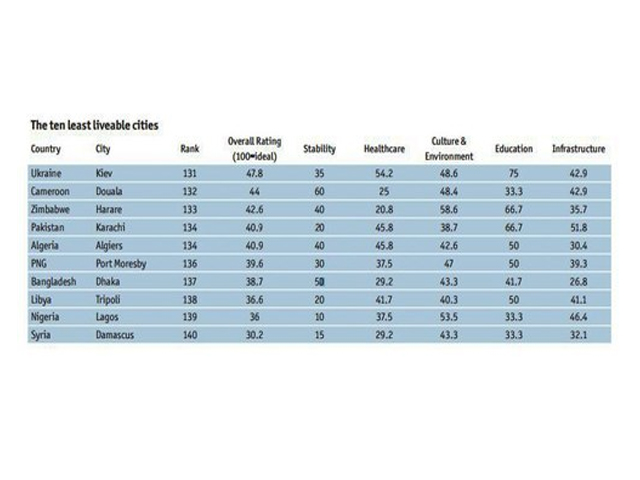
The ranking is based on the quantitative and qualitative factors including the stability of life, healthcare, culture, education, environment and infrastructure. The Least liveable cities according to “The Global Livability Report 2017 —The Economist Intelligence Unit” only include "cities or business centres that people might want to live in or visit" thus excluding cities that are under difficult circumstances like Kabul or Baghdad.

Australia and Canada shines the list of the most liveable cities with Melbourne securing the first position for the seventh time in a row.

Copyright Business Recorder, 2017
 

Comments

Comments are closed.