Abbott Laboratories (Pakistan) Limited
Abbott Laboratories (Pakistan) Limited (PSX: ABOT) was set up in 1948 as a public limited company. The company manufactures, imports, and markets branded generic pharmaceutical, nutritional, diagnostic, diabetes care, molecular devices, hospital and consumer products.
Shareholding pattern

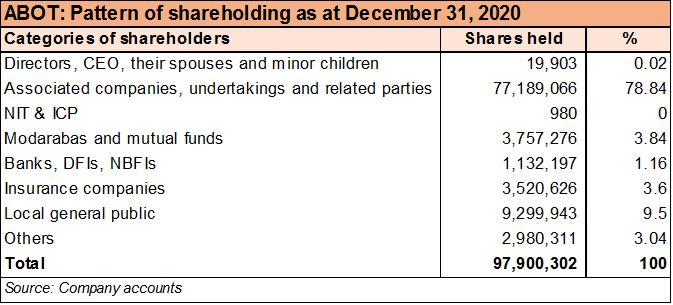
As at June 30, 2020, nearly 79 percent of the total shares are with the associated companies, undertakings and related parties. Within this category, a key shareholder is M/S. Abbott Asia Investments Limited that holds almost 78 percent shares. The directors, CEO, their spouses and minor children own less than 1 percent shares, whereas close to 4 percent shares are held in modarabas and mutual funds. The local general public has 9.5 percent shares, while the remaining about 8 percent shares are with the rest of the shareholder categories.
Historical operational performance
The topline for the company has been continuously rising over the years, albeit at varying rates; profit margins, on the other hand, have remained stable before declining CY17 onwards, bottoming out in CY19, and improving again in CY20.

In CY17, topline witnessed an over 11 percent rise, backed largely by local sales, that makes up a dominant share in the total revenue pie; local sales saw a nearly 12 percent increase while export sales saw a 9 percent rise. Within the various business segments, pharmaceuticals division saw the highest growth in sales at 13 percent, followed by the nutritional segment at 10 percent. Cost of production, on the other hand, increased to over 61 percent; this was attributed to the general inflationary pressures. With other factors remaining more or less similar, the decline in gross margin, also trickled down to the bottomline. While net profit was higher year on year in value terms, net margin was lower at 16 percent for the year.

Topline continued to increase in CY18, with revenue growth recorded at over 14 percent. Again, local sales saw a higher growth at 14 percent, where export sales increased by over 11 percent. Between business divisions, nutritional sales recorded an over 22 percent rise in sales, followed by the “others” division at 14 percent; pharmaceutical division saw close to 12 percent increase in its sales. On the other hand, cost of production jumped to make up 67 percent of revenue. This was due to the currency devaluation and inflation; the former results in pricey imports that the pharmaceutical sector relies on. Operating expenses also made a larger share in revenue year on year, whereas the rise in other expenses was due to the exchange loss. Thus, gross margin fell to nearly 33 percent while net margin was recorded at 9 percent- the lowest seen thus far.

The company saw the slowest revenue growth in CY19, at a little over 2 percent. Export sales increased by 41 percent, reaching Rs 2 billion in sales. On the other hand, local sales declined marginally by 1 percent. Segment-wise, nutritional sales registered a 16 percent rise, followed by 8.6 percent rise in “others” category. Pharmaceutical sales, however, saw a decline of nearly 3 percent. This was attributed to the general economic and regulatory environment. Cost of production further climbed on to consume almost 72 percent of revenue, bringing gross margin down to 28 percent- the lowest seen. while distribution and administrative expenses continued to register increases as a share in revenue, along with other income also declining, net margin fell to an all-time low of 4.3 percent.

Revenue growth recovered in CY20 as it was recorded at 17 percent. Export sales fell by over 27 percent, while local sales witnessed a growth of nearly 22 percent. All the business segments saw an increase in their sales; pharmaceutical sales by 12.7 percent, nutritional sales by 39 percent, diagnostics by 4 percent, and “others” by 5 percent. The rise in topline helped to improve gross margin, while distribution expenses made a lower share in revenue year on year due to lower traveling expenses and promotional activities. Other expenses increased due to Workers’ Profit Participation Fund (WPPF), Workers’ Welfare Fund (WWF) and Central Research Fund (CRF), while other income increased due to a one-off event of liabilities written back. Thus, net margin was higher at almost 13 percent year on year.
Quarterly results and future outlook
Net sales for 1QCY21 were higher by over 22 percent year on year; local sales registered a 20 percent rise, while export sales more than doubled. Along with this, cost of production reduced to nearly 62 percent that helped to raise gross margin to 38 percent. Distribution expenses may have risen as business activities had resumed in the second half of CY20 and continued till the first quarter of CY21. With other expenses reducing and other income rising, net margin was also higher at 14.6 percent, compared to 10.7 percent in 1QCY20.

The sector as a whole face the uncertainty and risk that comes with exchange rate fluctuation since it relies on imported APIs, that makes up a large part of its input costs. Therefore, any changes in exchange rates creates a ripple effect for the sector.


Comments
Comments are closed.