Habib Sugar Mills Limited (PSX: HABSM) is a public limited company established in 1962. The company manufactures and markets refined sugar, ethanol, liquidified carbon dioxide (CO2), and household textiles. It also provides bulk storage facilities and trades commodities.
Shareholding pattern

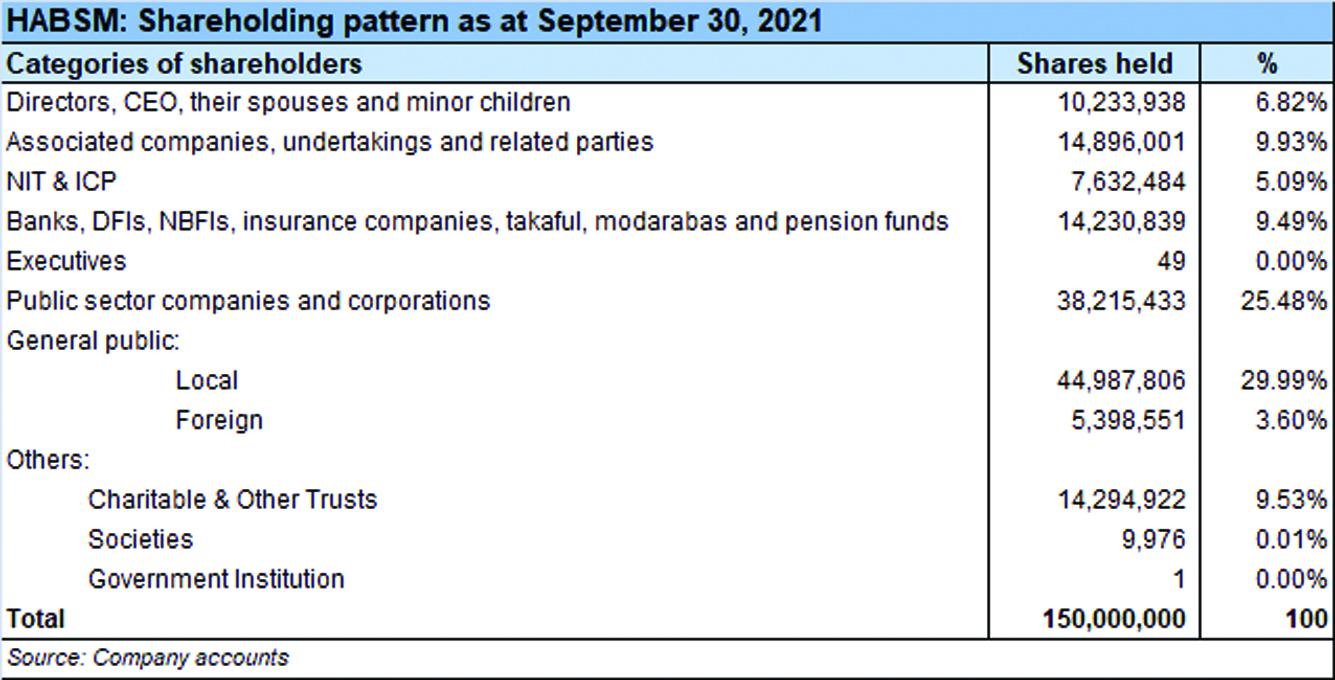
As at September 30, 2021, over 25 percent shares are held by the public sector companies and corporations. Close to 30 percent shares are with the local general public, followed by 10 percent in each of the following: associated companies, undertakings and related parties, charitable and other trusts and banks, DFIS, NBFIs, etc. The directors, CEO, their spouses and minor children own close to 7 percent shares. The remaining roughly 9 percent shares are with the rest of the shareholder categories.
Historical operational performance
In more than a decade, the company has witnessed a few years of contracting topline, while profit margins specifically in the last six years have fluctuated. They increased between MY17 and MY19, declined in MY20 before improving again in MY21.
In MY18, revenue increased by 8.7 percent, to reach Rs 7.7 billion. There were increases in revenue from the following divisions: sugar, which is also the highest contributor to the total revenue, distillery division, and textile division. The trading division saw a decrease of 65 percent; it had the lowest contribution to the total revenue. Moreover, the decrease in cost of production as a share in revenue from almost 92 percent to over 83 percent allowed gross margin to double from 8.3 percent to 16.4 percent. This also trickled down to the bottomline that was posted at Rs 901 million and a net margin of 11.6 percent. This has been the highest thus far.

At over 27 percent in MY19, revenue grew by one of the highest growth rates seen since MY08. Topline neared Rs 10 billion, with revenue from sugar division increasing by 42.6 percent, with distillery and trading division also seeing a rise. With a slight rise in cost of production, gross margin reduced to the same effect. However, net margin continued to grow due to an increase in finance income combined with a decrease in operating expenses as a share in revenue. Other income also increased due to receipt of cash freight subsidy, while finance income grew on the back of profit on term deposits. Thus, net margin was recorded at over 12 percent for the year.

Growth in revenue was subdued at 2.7 percent, with topline crossing the Rs 10 billion mark. The sugar division saw a decrease in revenue by 8.4 percent, while revenue from the trading division more than doubled in value terms as it rose from Rs 440 million in MY19 to over Rs 1 billion in MY20. However, production cost saw a more than corresponding rise at 89 percent of revenue, causing gross margin to reduce to 10.8 percent. With an increase in other expenses and fall in other income, operating margin was also squeezed to 5 percent. The fall in net margin was somewhat contained at 6.85 percent due to the contribution by finance income that increased from Rs 134 million in MY19 to Rs 274 million in MY20.

Revenue in MY21 contracted by 2.2 percent. This was due to nearly zero trading activity taking place during the year, which meant the revenue from the trading division fell from Rs 1 billion in MY20 to Rs 27 million in MY21. As costs reduced to 86 percent of revenue, gross margin improved to 13.7 percent. The effect on operating margin was more pronounced that grew from 5.2 percent to 11 percent in MY21 due to a rise in other income and a reduction in other expense. The latter was a result of zero provision for gas infrastructure development cess and impairment investment in HSM Energy, while other income was higher due to significant dividend income. The effect also trickled down to the bottomline that was recorded at Rs 990 million with a net margin of nearly 10 percent.
Quarterly results and future outlook
Revenue in the first quarter of MY22 was higher by over 38 percent year on year. This can be attributed primarily to the sugar division that saw its revenue more than doubling year on year from Rs 598 million in 1QMY21 to Rs 1.6 billion in 1QMY22. But the 38 percent higher revenue was also accompanied by a more than corresponding rise in costs at nearly 85 percent of revenue. Therefore, despite the increased topline, the company witnessed a lower profitability at a net margin of 10.5 percent compared to nearly 21 percent seen in the same period last year.

The company states that the Sindh Government fixed a higher support price for sugar cane compared to the Punjab government. With the hold back in supply of sugar cane by the growers, there is an unhealthy price competition among mills. The increase in price of sugarcane will undoubtedly increase the cost of production, and therefore adversely affect the profitability of the division.


Comments
Comments are closed.