Pre-floods, the country’s microfinance sector seemed to be on a steady path at the tail end of the pandemic. As per the recent data for the Apr-Jun 2022 quarter from Pakistan Microfinance Network (PMN), which is the sector’s representative body, there was decent quarterly and yearly growth in the number of borrowers and savers. It remains to be seen to what extent the devastating floods (on top of economic slowdown, high inflation, and load-shedding) have affected the country’s microfinance sector
At the end of June 2022, the PMN’s aggregated data from some three dozen Microfinance Providers (MFPs, which include both Microfinance Banks (MFBs) and Non-Banking Microfinance Providers (NBMFPs) in the data) show that the number of active borrowers had reached 8.5 million. This reflects 6 percent annual growth since June 2021 and 3 percent quarterly growth since March 2022. About 63 percent of active borrowers are with MFBs, and the remaining over one-third belong to the NBMFPs.

The jump in the gross loan portfolio (GLP) has been much higher in this timeframe. Standing at nearly Rs449 billion as of June 2022, there has been year-on-year growth of 26 percent and quarter-on-quarter growth of 8 percent in the sector’s loan book. As of June 2022, about 77 percent of GLP is held by MFBs and the rest by NBMFPs. The quarterly growth rate in GLP was the highest since December 2018, indicating larger financing needs faced by the micro borrowers in the target markets.
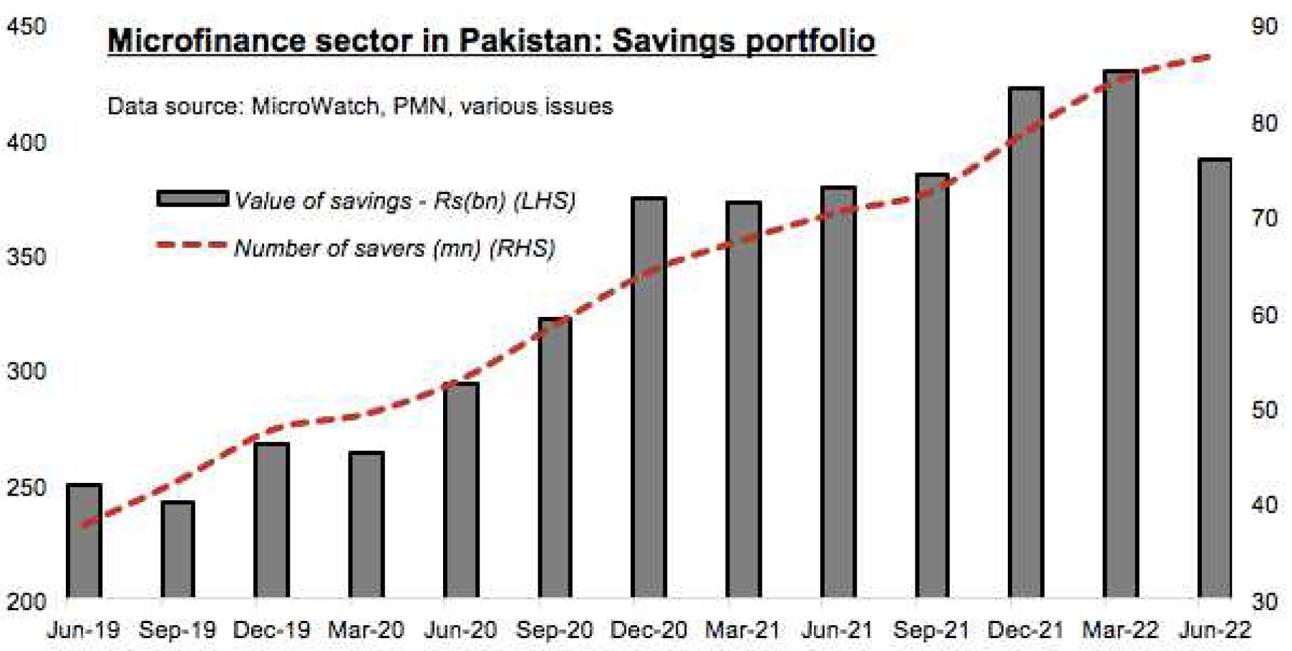
On the savings front, which has delivered strong growth in recent years, things could have been better. While it is good to see that number of savers grew 23 percent year-on-year to reach 87 million by June end 2022, the quarterly increase of 3 percent marked one of the slowest quarters in recent years. Consider the fact that 85 percent of savers are accounted for by m-wallets and the rest by traditional branches, the slowdown in m-wallet growth has impacted overall number of microfinance savers.

Meanwhile, the value of savings – in which branch-based savings accounts have a share of 82 percent versus 18 percent for m-wallets – has not shown reciprocal growth, as it’s becoming harder for folks to save amidst rising expenses. Savings stood at Rs391 billion by June end of 2022 – a decline of 9 percent since March 2022 and a growth of just 3 percent in the year since June 2021. The quarterly slump in the value of savings came after a gap of six quarters, and it was the biggest quarterly decline in recent years.
The PMN reported that the sector’s share of the loan portfolio that is at risk for over 30 days – referred to here as portfolio-at-risk (PAR) – “experienced a marginal increase of 0.13 percent”. In the future, one hopes that the PMN will provide more information on PAR, including disaggregated infection ratios for MFBs and NBMFPs. Thus far in CY22, MFPs’ combined loan book has expanded more than their savings portfolio. If this trend persists, the sector may have to improve liquidity management, at a time when the cost of external financing from commercial banks and other financial institutions has drastically increased.


Comments
Comments are closed.