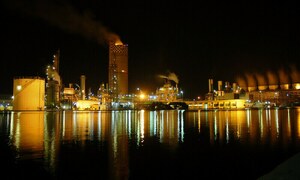
Murree Brewery Company Limited (PSX: MUREB), which is a famous producer of soft drinks, alcoholic beverages, mineral water and food products, has had a good start to the new financial year so far as topline growth alone is concerned, as per the latest company financial results posted to the bourse for the three-month period ended September 30, 2022. However, at the same time, the rising production costs and operating expenditures are chipping away fast at the firm’s profit margins.
For some background, MUREB has three main business units: Liquor division, Tops division, and Glass division. The Liquor division (which produces and sells alcoholic and non-alcoholic beverages) usually accounts for 70 percent of gross turnover; the Tops division (which makes and sells juices, mineral water and food products) usually provides 29 percent of gross turnover; and about 1 percent normally comes from the Glass division (which deals in production and sale of glass jars and bottles).
The net turnover growth of 21 percent year-on-year to Rs4.49 billion in 1QFY23 carries the growth momentum of FY22, when topline growth of 30 percent year-on-year took net turnover to Rs15.23 billion. However, as economy-wide inflationary pressures, which have raised cost of production on supply side and dented purchasing power on demand side, have clearly impacted fortunes of manufacturers, MUREB is also absorbing the blow to its profit margins despite healthy topline growth.

During 1QFY23, the cost of sales grew by 34 percent year-on-year to reach Rs3.69 billion, an increase that was out-of-step with the topline growth. As a result, these costs consumed 82 percent of net turnover, almost 8 percentage points higher than in the same period last fiscal. The effect was visible in a reduced gross margin of 17.7 percent in the quarter under review, compared to 25.5 percent in 1QFY22.
The growth in administrative expenses as well as the selling and distribution expenses was also higher relative to turnover growth. As a result, the operating profitability for the quarter under review slumped by a half to Rs271 million. Consequently, the firm’s operating margin declined to 6 percent (1QFY22: 14.1%). This is a break from FY22, when MUREB’s operating profitability had expanded by 27 percent year-on-year to reach Rs1.83 billion.
In the end, despite a bit of help from ‘finance income’ (which is income earned on financial assets), the firm closed the first quarter with its net profit declining by two-fifth to Rs258 million. The net margin came down to 5.8 percent, compared to 11.8 percent in 1QFY22. The operating environment is not getting any easier as cost pressures are expected to sustain, making it challenging for producers to optimize costs. Let’s see what the remaining quarters of the fiscal have in store for Murree!


Comments
Comments are closed.