Profits up for NetSol!
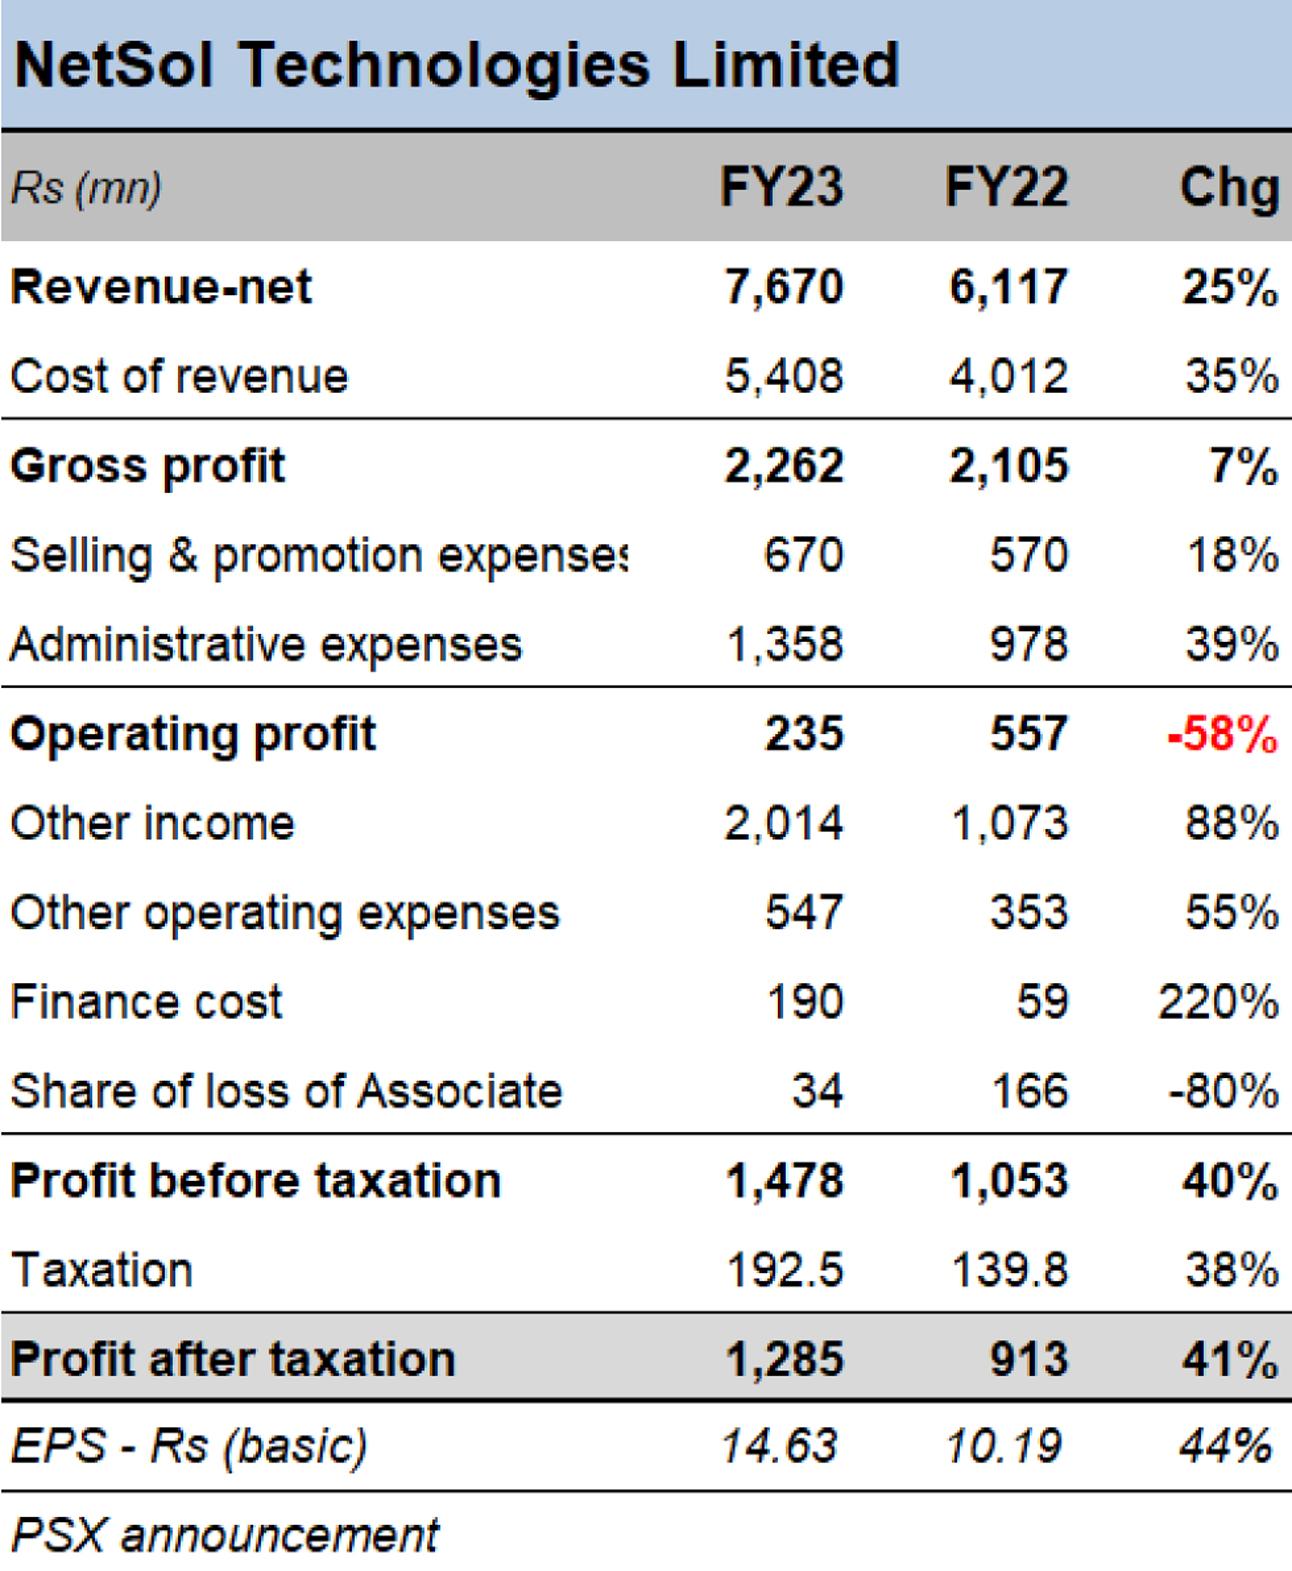
After a stellar FY22, growth continued to pour in for NetSol Technologies Limited (PSX: NetSol). Buoyed by strong operating performance and currency-related gains, one of Pakistan’s leading IT companies has had a profitable year. As per the latest results posted to the bourse, NetSol Technologies Limited saw its topline grow by 25 to reach Rs7.67 billion, with over 40 percent year-on-year expansion in its bottomline to Rs1.285billion, for the year ended June 30, 2023.
Analyzing the performance during FY23, the IT giant that sources majority of its sales by exporting products/services such as NetSol Financial Suite (NFS) Ascent, NFS Digital, and NFS Ascent on Cloud to clients in Asia-Pacific, North America and Europe – however posted a 58 percent yearlydecline in operating profits to Rs235 million. The net-revenue growth of 25 percent year-on-year was likelydue togrowth in license revenues as well as growth pouring in revenues from ‘subscription and support’ services SaaS.

The fall in operating profit for FY23 is likely to have come from higher human capital cost amid higher inflation. As human resource is the main cost for an IT company, it is expected to have to push down gross margins. Those cost pressures are apparent in NetSol’s more-than-proportional growth in cost of revenues (71 YoY growth) relative to topline growth of 25 percent. It helped that the selling and promotion expenses’ growth was in single digits, while administration expenses were also within the line. Gross margins fell from 34 percent to 29 percent in FY23, while the operating margins were down from 9.1 percent to 3.1 percent during the year.
However, NetSol’s net margins were seen growing from 14.9 percent to 16.8 percent in FY23, and the growth came significantly from higher other income and a decline in share of loss from associate. The firm’s ‘other income’ jumped by 88percent - or a growth of almost Rs1 billion to cross Rs2 billion in FY23. This absolute increase relative to the last fiscal owes mainly to the exchange-gains resulting from the large amount of depreciation that PKR witnessed against the US dollar and other global currencies during the year. As a result, the scale of net profit achieved by NetSol in FY23 is the highest since FY19.


Comments
Comments are closed.