
Attock Petroleum Limited (PSX: APL) is the oil marketing company of the Attock Oil Group, the only integrated oil group in the country with Pakistan Oilfields Limited as The E&P firm, and Attock Refinery and National Refinery Limited in the downstream refining segment.
APL is involved in the downstream petroleum business, incorporated in 1998, and its portfolio consists of lubricants, commercial and industrial fuels. APL markets and supplies fuels to manufacturing industry, armed forces, power producers, government/semi-government entities, FMCG companies, developmental sector, agricultural customers etc. its key commercial and industrial fuels include high speed diesel, motor spirit, jet fuel, kerosene oil, asphalt, furnace oil, light diesel oil and lubricants. It also offers a range of lubricants, which include both automotive and industrial grades blended with base oils and additives.
Apart from facilitating export of naphtha to the Middle East, Far East and South Asia, APL also exports petroleum products to Afghanistan. APL has a huge storage and retail outlet network, which is working on to expand further. The growth in its network has been noticeable, reaching 618 retail outlets by March 31, 2018 versus 604 by June end, 2017.
Shareholding pattern
The OMC is largely held by Pharaon Investment Group Limited (Holding) S.A.L. R. Pharaon. & Fils was established in 1868 in Beirut, Lebanon and has regularly expanded and developed its activities in diversified fields such as insurance, household appliances, consumer electronics, agrochemicals, industrial and domestic gases, flavours and fragrances, pharmaceuticals and medical equipment. Attock Refinery Limited, Pakistan Oilfields Limited and Employee Welfare Fund are among other shareholders holding more than 5 percent of the voting rights in APL.
Past performance
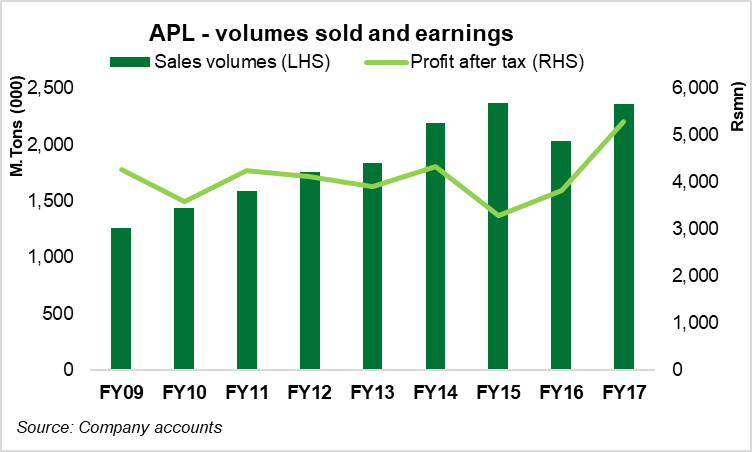
The oil-marketing segment has seen significant volumetric growth in recent years due to increased petroleum product consumption, and this is widely being led by the retail fuels. APL has also witnessed growth in the retail segment. Led by volumetric sales, growth in petroleum products consumption are seen starting from FY13 when the oil prices crashed and domestic sales started peaking up.
APL also witnessed the surge in sales volumes and thus growth in the number of retail outlets in FY13, which all came from rising retail fuel demand. The firm's core revenues were up by eight percent year-on-year, but the earnings slipped due to cost overrun, particularly administrative expenses and finance cost.
Things went well for the OMCs in FY14, driven largely by volumetric growth in retail fuels. APL was able to increase its market share from 9.3 percent in FY13 to 10.1 percent in FY14 due to its better product sales. The firm's revenues were up by 25 percent due to increase in volumes sold. However, higher inventory losses and increase in operating expenses due to stiff competition restricted margins during the year.
OMCs remained in headlines in FY15 as oil prices plunged to historic lows before recovering. However, the industry became more turbulent profitability wise as declining oil price in the global market significantly affected financial performance of downstream oil marketing companies. APL's overall sales volumes increased by eight percent, year-on-year. Its market share increased slightly from 10.1 percent in FY14 to 10.4 percent in FY15 due to its better product sales. However, like other OMCs, it also witnessed a fall in its revenues and earnings due to inventory losses, a reduction in HSD volumes, and petroleum prices.
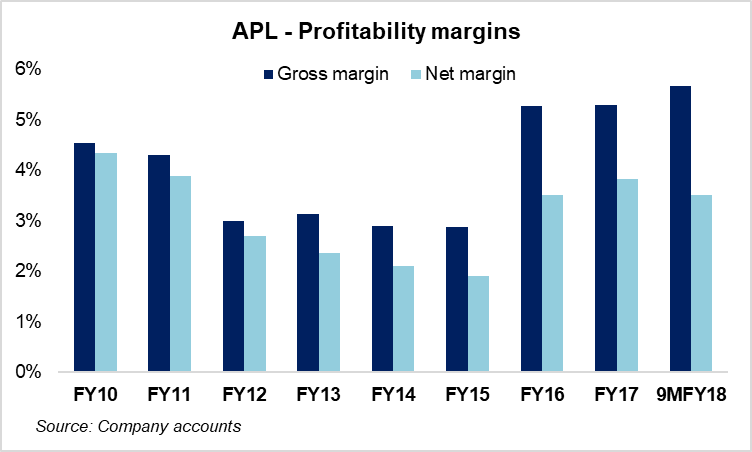
Improvement in gross margins for APL came in FY16 due to inventory gains even though there was a decline in volumes due to lower furnace oil sales. There has been a significant shift in the company's sales mix, which has tilted towards retail fuels: HSD and petrol - away from furnace oil an industry-wide phenomenon of reducing reliance on the expensive fuel.
The improvement in profitability continued for APL in FY17 as well as the firm saw higher sales revenues by almost 27 percent year-on-year after a year of falling top-line; HSD and Motor Gasoline (petrol) volumes grew by around 17 percent and 38 percent, respectively on a year-on-year basis. However, gross margins shrunk as the cost of sales rose in tandem. Nonetheless, effective inventory management, increased storage capacities and cost control measures resulted in higher earnings for APL in FY17 - up by 38 percent year-on-year.
9MY18 Performance
APL's focus in FY18 continues to be retail. In 9MFY18, APL sales revenues increased by 26 percent, which according to the firm has been due to increasing trend of petroleum prices during the period along with 8 percent year-on-year increase in sales volume against one percent decrease in industry sales volumes. However, the firm's bottom-line was down by a little over two percent, year-on-year. This was due higher operating expenses due to exchange losses from Rupee depreciation versus the dollar in recent times as well as due to reversal of provision of other charges relating to the Workers Welfare Fund recorded as per the decision of Supreme Court in the same period last year.
Outlook
While the firm might have seen a dent in its earnings recently, APL's rising retail presence and storage expansions makes a case for growth in the coming times. Mehmood Kot bulk oil terminal has started its operations while bulk oil terminal at Shikarpur is due to be commissioned during this year.
Also, a significant advantage that the company enjoys is its unleveled balance sheet and hence low sensitivity to the circular debt, giving it more room for capital expansion. The company has strengthened its supply chain cycle by regularly importing cargoes of Motor Gasoline and High Speed Diesel (HSD), and is also exploring alternate supply sources.
Of its recent ventures include the country's largest and most advanced fuel farm facility at the new Islamabad airport developed jointly with PSO. APL has also seen growth in its passenger motorcar lubricant sales similar retail growth trend in FY18 as well, it wouldn't be wrong to assume that the firm will continue to see growth in lubricant sales in the ongoing as well.
According to the latest financial reports, construction of terminals at Sahiwal, Tarujabba and Daulatpur is underway and lands at other locations are being acquired to establish bulk oil terminals to increase storage capacity for the company. The Company has also won contracts for fuel supply to Pakistan Army for 2018-19.
=============================================================
Attock Petroleum Limited-Shareholding Pattern (June 30, 2017)
=============================================================
Categories                                Percentage held (%)
=============================================================
DIRECTORS, CHIEF EXECUTIVE OFFICER,                      6.69
THEIR SPOUSES & MINOR CHILDREN
ASSOCIATED COMPANIES,                                   72.51
UNDERTAKINGS AND RELATED PARTIES
NATIONAL INVESTMENT TRUST &                              0.06
INDUSTRIAL CORPORATION OF PAKISTAN
BANKS, DEVELOPMENT FINANCE INSTITUTIONS,                 2.05
NON-BANKING FINANCIAL INSTITUTIONS
INSURANCE COMPANIES                                      3.46
MODARABAS & MUTUAL FUNDS                                 3.19
FOREIGN COMPANIES                                        1.32
TRUSTS AND FUNDS                                         1.87
JOINT STOCK COMPANIES                                    0.52
GENERAL PUBLIC (LOCAL)                                   6.92
GENERAL PUBLIC (FOREIGN)                                 0.02
=============================================================
Source: Company Accounts
===============================================================================
Attock Petroleum Limited
===============================================================================
                                FY13      FY14       FY15       FY16       FY17
===============================================================================
Profitability
Gross margin                   3.14%     2.90%      2.87%      5.26%      5.29%
Net margin                     2.37%     2.11%      1.91%      3.50%      3.82%
Operating leverage           -12.17%    22.80%    142.20%    -66.34%    136.12%
Return on equity              29.56%     31.1%      24.0%     27.47%     34.62%
Liquidity
Current ratio                   1.75      1.59       1.66       1.67       1.52
Quick ratio                     1.42      1.24        1.3       1.36       1.18
Cash to current liabilities     0.64      0.39       0.31       0.59       0.51
Activity
Inventory turnover             34.23     33.36      26.99      19.88      21.76
Debtor turnover                14.75     19.32      16.18      15.32      16.46
Creditor turnover               9.65     11.41       9.46       6.63       7.18
Total asset turnover            5.43      6.39       5.37       3.61       4.03
Fixed asset turnover           95.09    108.16      78.50      40.04      37.73
Investment
EPS (Rs/share)                 56.52     52.16      39.62      46.16      63.89
P/E                             9.93     11.31      14.32      19.48       9.48
Dividend yield                 8.96%     9.01%      6.26%      8.32%      6.94%
===============================================================================
Source: Company Accounts
===============================================
Attock Petroleum Limited
===============================================
Rs (mn)                 9MFY18    9MFY17    YoY
===============================================
Net sales              121,359    96,174    26%
Cost of sales          114,489    90,447    27%
Gross profit             6,870     5,726    20%
Other income               604       712   -15%
Operating expenses       1,885     1,382    36%
Operating profit         5,589     5,056    11%
Finance Income             943       836    13%
Finance cost               412       220    87%
PAT                      4,264     4,359    -2%
EPS (Rs/share)           51.41     52.56    -2%
Gross margin             5.66%     5.95%
Operating margin         4.61%     5.26%
Net margin               3.51%     4.53%
===============================================
Source: PSX


Comments
Comments are closed.