AIRLINK 176.49 Increased By ▲ 0.60 (0.34%)
BOP 10.93 Decreased By ▼ -0.05 (-0.46%)
CNERGY 8.31 Increased By ▲ 0.31 (3.88%)
FCCL 46.48 Increased By ▲ 0.36 (0.78%)
FFL 16.13 Increased By ▲ 0.06 (0.37%)
FLYNG 27.35 Decreased By ▼ -0.07 (-0.26%)
HUBC 146.78 Increased By ▲ 2.82 (1.96%)
HUMNL 13.28 Decreased By ▼ -0.07 (-0.52%)
KEL 4.47 Decreased By ▼ -0.03 (-0.67%)
KOSM 5.99 Increased By ▲ 0.01 (0.17%)
MLCF 59.39 Decreased By ▼ -0.11 (-0.18%)
OGDC 231.02 Decreased By ▼ -1.73 (-0.74%)
PACE 5.87 Decreased By ▼ -0.01 (-0.17%)
PAEL 47.43 Decreased By ▼ -0.05 (-0.11%)
PIAHCLA 17.90 Decreased By ▼ -0.07 (-0.39%)
PIBTL 10.56 Decreased By ▼ -0.02 (-0.19%)
POWER 11.31 Decreased By ▼ -0.07 (-0.62%)
PPL 191.98 Decreased By ▼ -1.32 (-0.68%)
PRL 37.70 Increased By ▲ 0.70 (1.89%)
PTC 23.73 Decreased By ▼ -0.04 (-0.17%)
SEARL 100.01 Increased By ▲ 0.14 (0.14%)
SILK 1.15 No Change ▼ 0.00 (0%)
SSGC 37.10 Decreased By ▼ -0.09 (-0.24%)
SYM 14.89 Decreased By ▼ -0.06 (-0.4%)
TELE 7.75 No Change ▼ 0.00 (0%)
TPLP 10.75 Decreased By ▼ -0.12 (-1.1%)
TRG 65.52 Increased By ▲ 0.38 (0.58%)
WAVESAPP 10.90 Decreased By ▼ -0.01 (-0.09%)
WTL 1.33 Decreased By ▼ -0.01 (-0.75%)
YOUW 3.80 Decreased By ▼ -0.01 (-0.26%)
BR100 12,611 Increased By 2.4 (0.02%)
BR30 39,374 Increased By 111.2 (0.28%)
KSE100 117,903 Increased By 130.5 (0.11%)
KSE30 36,320 Increased By 24.1 (0.07%)
World

Floods swamp 3.6mn ac US farmland;farm group

WASHINGTON : Nearly 3.6 million acres of farmland in the Mississippi River valley, including 40 percent of US r
Published May 23, 2011

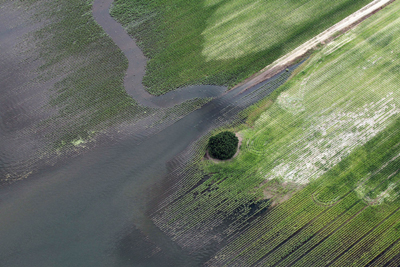
 WASHINGTON: Nearly 3.6 million acres of farmland in the Mississippi River valley, including 40 percent of US rice area, have been affected by spring flooding, said the largest US farm group on Monday.

The figure was larger than earlier reports of 3 million acres of flooded farmland and amounts to 1.1 percent of land usually planted in the two dozen principal US field crops.

Arkansas is the hardest-hit with 1 million acres flooded, including 300,000 acres of rice and 120,000 acres of wheat, said the American Farm Bureau Federation, based on a survey of its state affiliates.

AFBF listed flood totals as 650,000 acres in Tennessee, 600,000 acres in Mississippi, 570,000 in Missouri, 500,000 acres in Illinois and 280,000 acres in Louisiana.

Bob Young, AFBF chief economist, said the economic impact of the flood will be massive but some growers still may be able to plant a crop this year.

"There is no doubt about it, the effect of the flooding on farmers and ranchers is being felt deeply across the south," Young said in a statement. "One is reminded of the '93 or '95 floods in terms of scale of affected area."

Analysts say flooding and a rainy, cold spring may disrupt farmers' plans to expand US corn plantings by 5 percent this year, to 92.2 million acres and rebuild lean stockpiles. Last week, the Linn Group estimated corn plantings will total 89.5 million acres and soybean planting would reach 75.1 million acres, compared to the 76.6 million acres estimated by USDA based on a survey of growers in March.

Doubts about the size of the US corn crop are driving up futures prices, said agricultural economist Darrel Good at the University of Illinois on Monday. Speculation about corn plantings will continue until June 30, when the Agriculture Department reports on its farmer survey of crop plantings.


Copyright Reuters, 2011


Comments

Comments are closed.