Despite two percent increase of energy supply, the electricity generation showed only a marginal increase of 0.3 percent, while the number of consumers increased to 15.6 million from 14.9 million, says Economic Survey 2005-06.
The survey, which covers the first nine months of the outgoing fiscal year, further said the oil production also showed a decrease of 1.23 percent, while gas showed 4.4 percent production growth.
In the first three quarters of the outgoing fiscal year, the consumption of petroleum products in household, agriculture, transport and the power sector showed a declining trend, while energy supply registered an increase of two percent.
The Economic Survey data also said the decline in the use of petroleum products in households, agriculture, transport and power sectors, was due mainly to the availability of alternative and relatively cheaper fuels, low demand of LDO in agriculture and lastly, the massive increase of CNG and natural gas in transport and power sectors.
The consumption of gas in cement industry increased by 25 percent, while the power sector consumption grew by 9.9 percent followed by the fertiliser industry (8.0 percent), industrial sector (7.9 percent) and household sector (0.7 percent), it said, adding that a substantial increase in the consumption of electricity has also been witnessed during the first nine months of the current fiscal year.
The energy supplies increased to 42.449 million TOE from 41.617 million TOE, which is an increase of two percent, mainly due to appropriate and timely measures taken by the government to provide an investment-friendly environment for the energy sector to attract more local and foreign investors, the survey said.
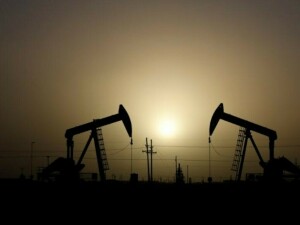
The average crude oil production during July-March 2005-06 was 65,385 barrels per day as against 66,199 barrels per day during the corresponding period last year, showing a decrease of 1.23 percent and is due mainly to lower production by 10 percent from southern region oil fields.
The average production of natural gas during July-March 2005-06 was 3,826 million cubic feet per day (mmcfd) as against 3,663 mmcfd during the corresponding period last year, showing an increase of 4.4 percent.
The total installed capacity of electricity generation increased to 19,439 MW in 2005-06 from 19,389 MW last year, showing a marginal increase of 0.3 percent.
The number of electricity consumers has increased over the years due to rapid extension of electric supply to villages and fast urbanisation. The number of consumers has increased to 15.6 million, up to March 2006, from 14.9 million in 2004-05, showing an increase of 5 percent over the last year and a growth of 64 percent since 1995-96.
The NTDC and Discos have reduced power losses thus increasing the revenue by adopting measures such as renovation, rehabilitation, capacitor installation and strengthening consumer-end distribution supply network. It decreased the power losses from 24.2 to 22.8 percent during the first nine months.
The government has approved the recommendations under the Energy Security Action Plan, which include development of wind and solar energy to ensure that at least five percent of total power generation capacity is met through these resources by 2030 ie (9700 MW), it said.
The Alternative Energy Development Board to ensure the installation of 100 MW wind power by June 2006 at Keti Bandar and Gharo in Sindh and 700 MW by 2010, the survey added.
Due to the import of high cost energy resources, the government will enhance the share of coal in the overall energy mix from 5 percent to 18 percent up to 2018.
The Energy Security Action Plan has also set a target of generating about 20,000 MW power from coal by 2030 and 50 percent by 2050, the Economic Survey added.
BR100
11,814
Increased By
90.4 (0.77%)
BR30
36,234
Increased By
874.6 (2.47%)
KSE100
113,247
Increased By
609 (0.54%)
KSE30
35,712
Increased By
253.6 (0.72%)


Comments
Comments are closed.