All growth is mathematics; but some growth is more mathematics than others. Such seems to be the case of Pakistan’s Large Scale Manufacturing (LSM) Index.

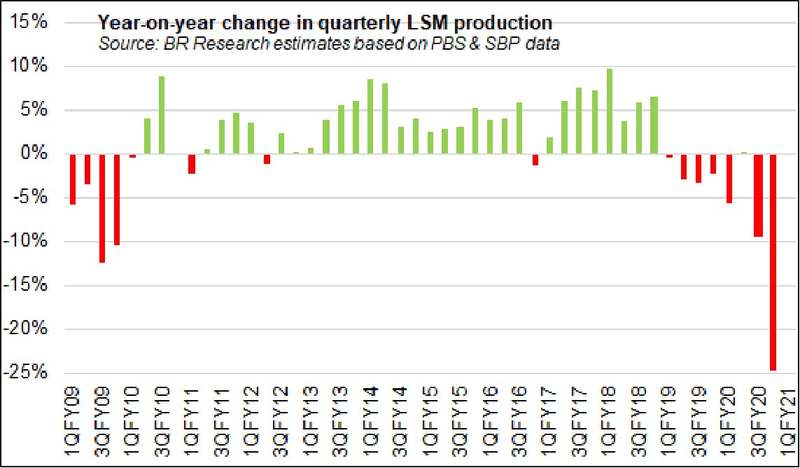
Latest data reported by Pakistan Bureau of Statistics shows that LSM has grown 3.66 percent year-on-year in the first two months of FY21. This is marked improved over consistent year-on-year fall in production during peak Covid months in the last quarter of FY20. There is little doubt that first quarter FY21 will report the first noticeable quarterly growth since June 2018.

But there is also little doubt that growth is largely because the worst seems to be over for LSM and not because production has reached pre-Jul 2018 levels. As the graphs here suggest, growth in 2MFY21 appears to stem from the low base affect set since the start of FY20 – one that will be more pronounced in the last quarter of FY21. Cheerleaders may shout hurrah, but credits here only to the degree that the worst is possibly way behind. Cheerleading aside; growth engines can’t be said to be really fired up until at least production numbers reach pre-Jul 2018 levels.

There is also little doubt that whilst the recovery is broad based as far as lockdown period is concerned (51 items out 112 items reported a fall in 2MFY21 as against average of 73 in Mar-May 2020), it is nevertheless little changed over the last few years (see table for 2MFY21 compared to 2MFY20 & 2MFY19).

While the latest round of central bank’s Business Confidence Index is back in the green zone after remaining in the negative zone for the last three waves, whereas its Purchasing Managers Index also seems to have bottomed out with improvements reported in August 2020 over June 2020, it is still too early to call victory for LSM given gradual resurgence of Covid in Pakistan and elsewhere in the world which may impair export prospects. Fortune will favour the prepared. Touchwood!


Comments
Comments are closed.