Hinopak Motors Limited (PSX: HINO) was set up as a public limited company; Hino Motors Japan and Toyota Tsusho Corporation collaborated with Al Futtaim Group of UAE and PACO Pakistan to form Hinopak Motors Limited in 1986.
The company’s main business is “assembly, progressive manufacturing and sale of Hino buses and trucks”.
Shareholding pattern
As at March 31, 2020, a large majority of the shares are held by the associated companies, undertakings and related parties. This category includes Hino Motors Limited and Toyota Tsusho Corporation, Japan. Close to 6 percent shares are with the local general public, while the directors, CEO, their spouses and minor children hold less than 1 percent shares in the company. The remaining 5 percent shares are the rest of the shareholder categories.

Historical operational performance
The topline of the company declined in the last two years while gross margins have been on a gradual decline since MY14.

During MY17, the company witnessed a little over 24 percent growth in its net revenue, claiming 60 percent of the market in the bus segment, and 41 percent in the truck segment. However, cost of production was higher year on year, as its share in revenue; it consumed 89 percent of the revenue. This was attributed to a higher cost of import. Therefore, the higher sales could not translate into higher profitability. Gross margin contracted to near 11 percent that also trickled down to net margin which was recorded at almost 5 percent. However, the reduction in net margin was not as pronounced due to fall in finance expense. This was due to a significantly lower exchange loss in MY17 as compared to Rs 294 million seen in MY16.

Growth rate in net revenue at 18 percent during MY18 was notably lower than that seen in the previous three years. In absolute terms, however, the company saw the highest topline at over Rs 26.6 billion. During the year, demand for commercial vehicles increased. In the truck segment the company claimed a market share of 43 percent, and 38 percent in the bus segment. Cost of production was very marginally lower year on year at 88.6 percent of revenue, therefore profit margins and the bottomline remained nearly flat; net margin stood at 4.3 percent for the year. Finance cost increased significantly due to a comparatively massive exchange loss of Rs 637 million, but the increase here was offset by decrease in expenses, keeping profit margins unchanged.

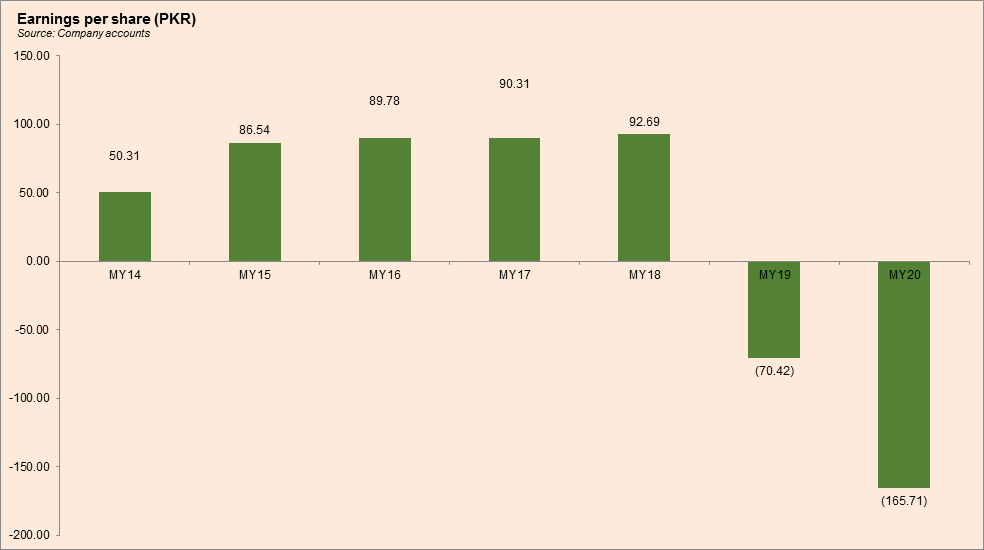
Revenue for Hinopak Motors contracted by 28 percent during MY19. The overall commercial vehicle industry also exhibited a downward trend as the total market size contracted by 14 percent. This was mainly attributed to the currency devaluation against US$ coupled with a slow down in CPEC related activities as due to “curtailment by government spending in the project”. The currency devaluation also had its impact on cost of production that rose to make up over 94 percent of revenue, shrinking gross profit by three times year on year. Gross margin was nearly halved to 5.8 percent, while due to over Rs 1 billion of finance expense, the company incurred a loss of Rs873 million.

The company saw the highest reduction in topline at 31 percent during MY20. The market size of the commercial vehicle industry reduced by 44 percent. The company’s market share in the truck segment stood at 31.5 percent and 41.5 percent in the bus segment. Moreover, since the company is operating in an import-oriented sector, the currency devaluation wreaked havoc. Cost of production exceeded the topline resulting in a gross loss of Rs 170 million; sales volumes were already adversely impacted due to the economic downturn. With other income almost disappearing and finance expense continuing to make a larger part of the revenue, Hinopak’s bottomline contracted to a negative Rs 2 billion.
Quarterly results and future outlook
Topline fell by 40 percent year on year during 9MMY21. Sales volumes for the industry overall during the nine months between April to December 2020 stood at 2375 units; lower by 36 percent year on year. This was attributed to the nationwide lockdown owing to the Covid-19 pandemic. For Hinopak, sales volumes for trucks and buses decreased to 511 units compared to 1277 units. Despite lower volumes, owing to a curtailment in cost of production, the company posted a positive gross profit compared to the gross loss incurred same period last year (SPLY). Despite this, costs did exceed 90 percent of revenue. Therefore, the company incurred a net loss for the period, however, it was lower than that during 9MMY20.

The Covid-19 pandemic that affected the global economy also affected the Pakistani economy. However, owing to government’s measures such as announcing a stable monetary policy, the country was able to resume business activity. The commercial vehicle industry is dependent on resumption of economic activities as well as a stable currency against the dollar.


Comments
Comments are closed.