Fauji Cement Company Limited
Fauji Cement Company Limited (PSX: FCCL) was set up in 1992 under the Companies Ordinance, 1984. It is a public limited company, and began operations in the following year, in 1993. The company manufactures and sells various kinds of cement.
Fauji Cement Company initially started with a production capacity of 3,700 tons per day that has grown to 11,000 tons per day. It also has two Waste Heat Recovery Power Plants (WHRPPs) of 12 MW and 9 MW, one set up in 2015 and another in 2018.
Shareholding pattern

As at June 30, 2020, close to 50 percent shares are held by the associated companies, undertakings ad related parties. Within this category, the largest shareholder is Committee of Admin, Fauji Foundation (CDC), holding nearly 36 percent shares. Over 32 percent shares are held by the local general public, followed by nearly 9 percent in joint stock companies. The directors, CEO, their spouses and minor children own less than 1 percent shares, while the remaining about 9 percent shares are with the rest of the shareholder categories.
Historical operational performance
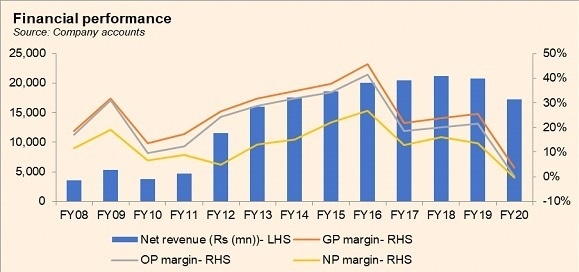
Fauji Cement Company Limited has mostly seen a rising topline with the exception of FY10, and then more recently in the last two years, that is, FY19 and FY20. Profit margins, on the other hand, have followed a declining trend after reaching a peak in FY16.

In FY17, the company experienced the slowest positive growth rates at close to 2 percent. total dispatches for the company grew by over 4 percent while, that for the industry grew by 3.7 percent. Domestic dispatches saw an 8 percent growth, whereas export dispatches reduced by over 20 percent. Another development during the year was the collapse of CF Silo Line 2 with regards to damages to Line 1 and 2, leading to a complete standstill. As a result, the company had to procure clinker from other cement plants. This caused a rise in the production cost as is depicted by 78 percent of revenue consumed by cost of production, compared to 54 percent seen in the previous year. Therefore, gross margin fell to 21.7 percent; this also trickled to the bottomline with net margin recorded at 12.8 percent for the year.

Revenue growth stood at 3.6 percent for FY18. Total dispatches for the industry witnessed a 14.9 percent rise, while the company’s dispatches saw a growth of 16.5 percent. Demand for cement was largely driven by domestic consumption due to a rise in housing, commercial and infrastructure projects. The growth in dispatches kept prices in check, therefore, the 16 percent growth in dispatches only translated into a 3.6 percent growth in revenue. Moreover, during the year, the company was able to start up Line 2 that reduced dependency on other cement plants for procurement of clinker. This also led to a reduction in production cost, as it consumed 76 percent of revenue, allowing gross margin to improve to 23.8 percent. With no significant change in operating and finance expenses as a percentage of revenue, coupled with tax expense being lower due to reversal of deferred tax, net margin grew to 16.2 percent for the year.

After growing for eight consecutive years, revenue contracted in FY19 by 1.7 percent. The industry’s total dispatches increased marginally by 1.9 percent, within which export dispatches saw double-digit growth but was offset by the decline in local dispatches. Although total dispatches increased, but in comparison to increased installed capacities, it had reduced. The economy generally also experienced a slow down amidst a government change. Production cost continued to decline, recorded at 74 percent of revenue. Therefore, gross margin also rose to over 25 percent. While this was reflected in the operating margin, the same could not be observed for net margin that reduced to 13.6 percent. This was due to a major charge of deferred tax expense.

In FY20, the company witnessed the highest contraction in revenue since FY11, at over 17 percent. Total dispatches for the industry grew by a marginal 2 percent, most of which was supported by sea exports; volumetrically, export sales saw a 20 percent growth. The company’s revenue was lower due to a reduction in retention price. The excess capacities created a downward pressure on selling prices due to over-supply, while demand remained below expectations. Demand was adversely impacted by lower PSDP allocation, and CPEC projects that was aggravated by the outbreak of the Covid-19 pandemic. Cumulatively, this led to production cost consuming over 96 percent of revenue, reducing gross margin to an all-time low of 3.8 percent. With further expenses incurred, the company posted a loss of Rs 60 million for the year.
Quarterly results and future outlook
FY21 saw improvement. Revenue grew by almost 30 percent in 1QFY21, year on year. As economic activities resumed as lockdowns, eased, demand and prices also picked up. Fuel and power expense is one of the major components of cost. The company managed to reduce these costs during the period by “maximizing its own power generation from its gas engines and solar plants to rationalize the power cost”, as is reflected in cost making 78.4 percent of revenue, compared to 86 percent in 1QFY20. Thus, net margin doubled year on year, to 12.7 percent for 1QFY21.

The second quarter saw revenue higher by almost 15 percent year on year; industry dispatches were 16 percent higher, while company’s dispatches were 9 percent higher. It was subdued due to reduction in exports due to Afghan border closure, whereas for the industry, export dispatches registered a 15 percent growth. The industry as a whole picked up as government announced infrastructure projects and incentives. Thus, net margin stood at 14.8 percent for 2QFY21.
The third quarter saw a 50 percent rise in revenue year on year, while margins, at 14.9 percent cumulatively for 9MFY21 improved due to higher dispatches and improved retentions. Industry demand is expected to grow while rising international coal prices and country’s electricity prices continue to pose a challenge.


Comments
Comments are closed.