Fauji Fertiliser Company Limited (PSX: FFC) was set up under the Companies Act, 1913 (now Companies Act, 2017). It is a public limited company that manufactures, purchases and markets fertilisers and chemicals. It has also invested in other fertilizer, chemical, cement, energy generation, food processing and banking operations.
Shareholding pattern

As at December 31, 2021, over 44 percent shares were held by the associated companies, undertakings and related parties, that includes Fauji Foundation and Committee of Admin. Fauji Foundation. About 22 percent shares are owned by the local general public, followed by almost 12 percent in public sector companies and corporations. Foreign companies hold about 7 percent shares, while the directors, the CEO, their spouses and minor children own less than 1 percent shares; another 7 percent shares are held with the banks, DFIs and NBFIs. The remaining roughly 7 percent shares are with the rest of the shareholder categories.
Historical operational performance
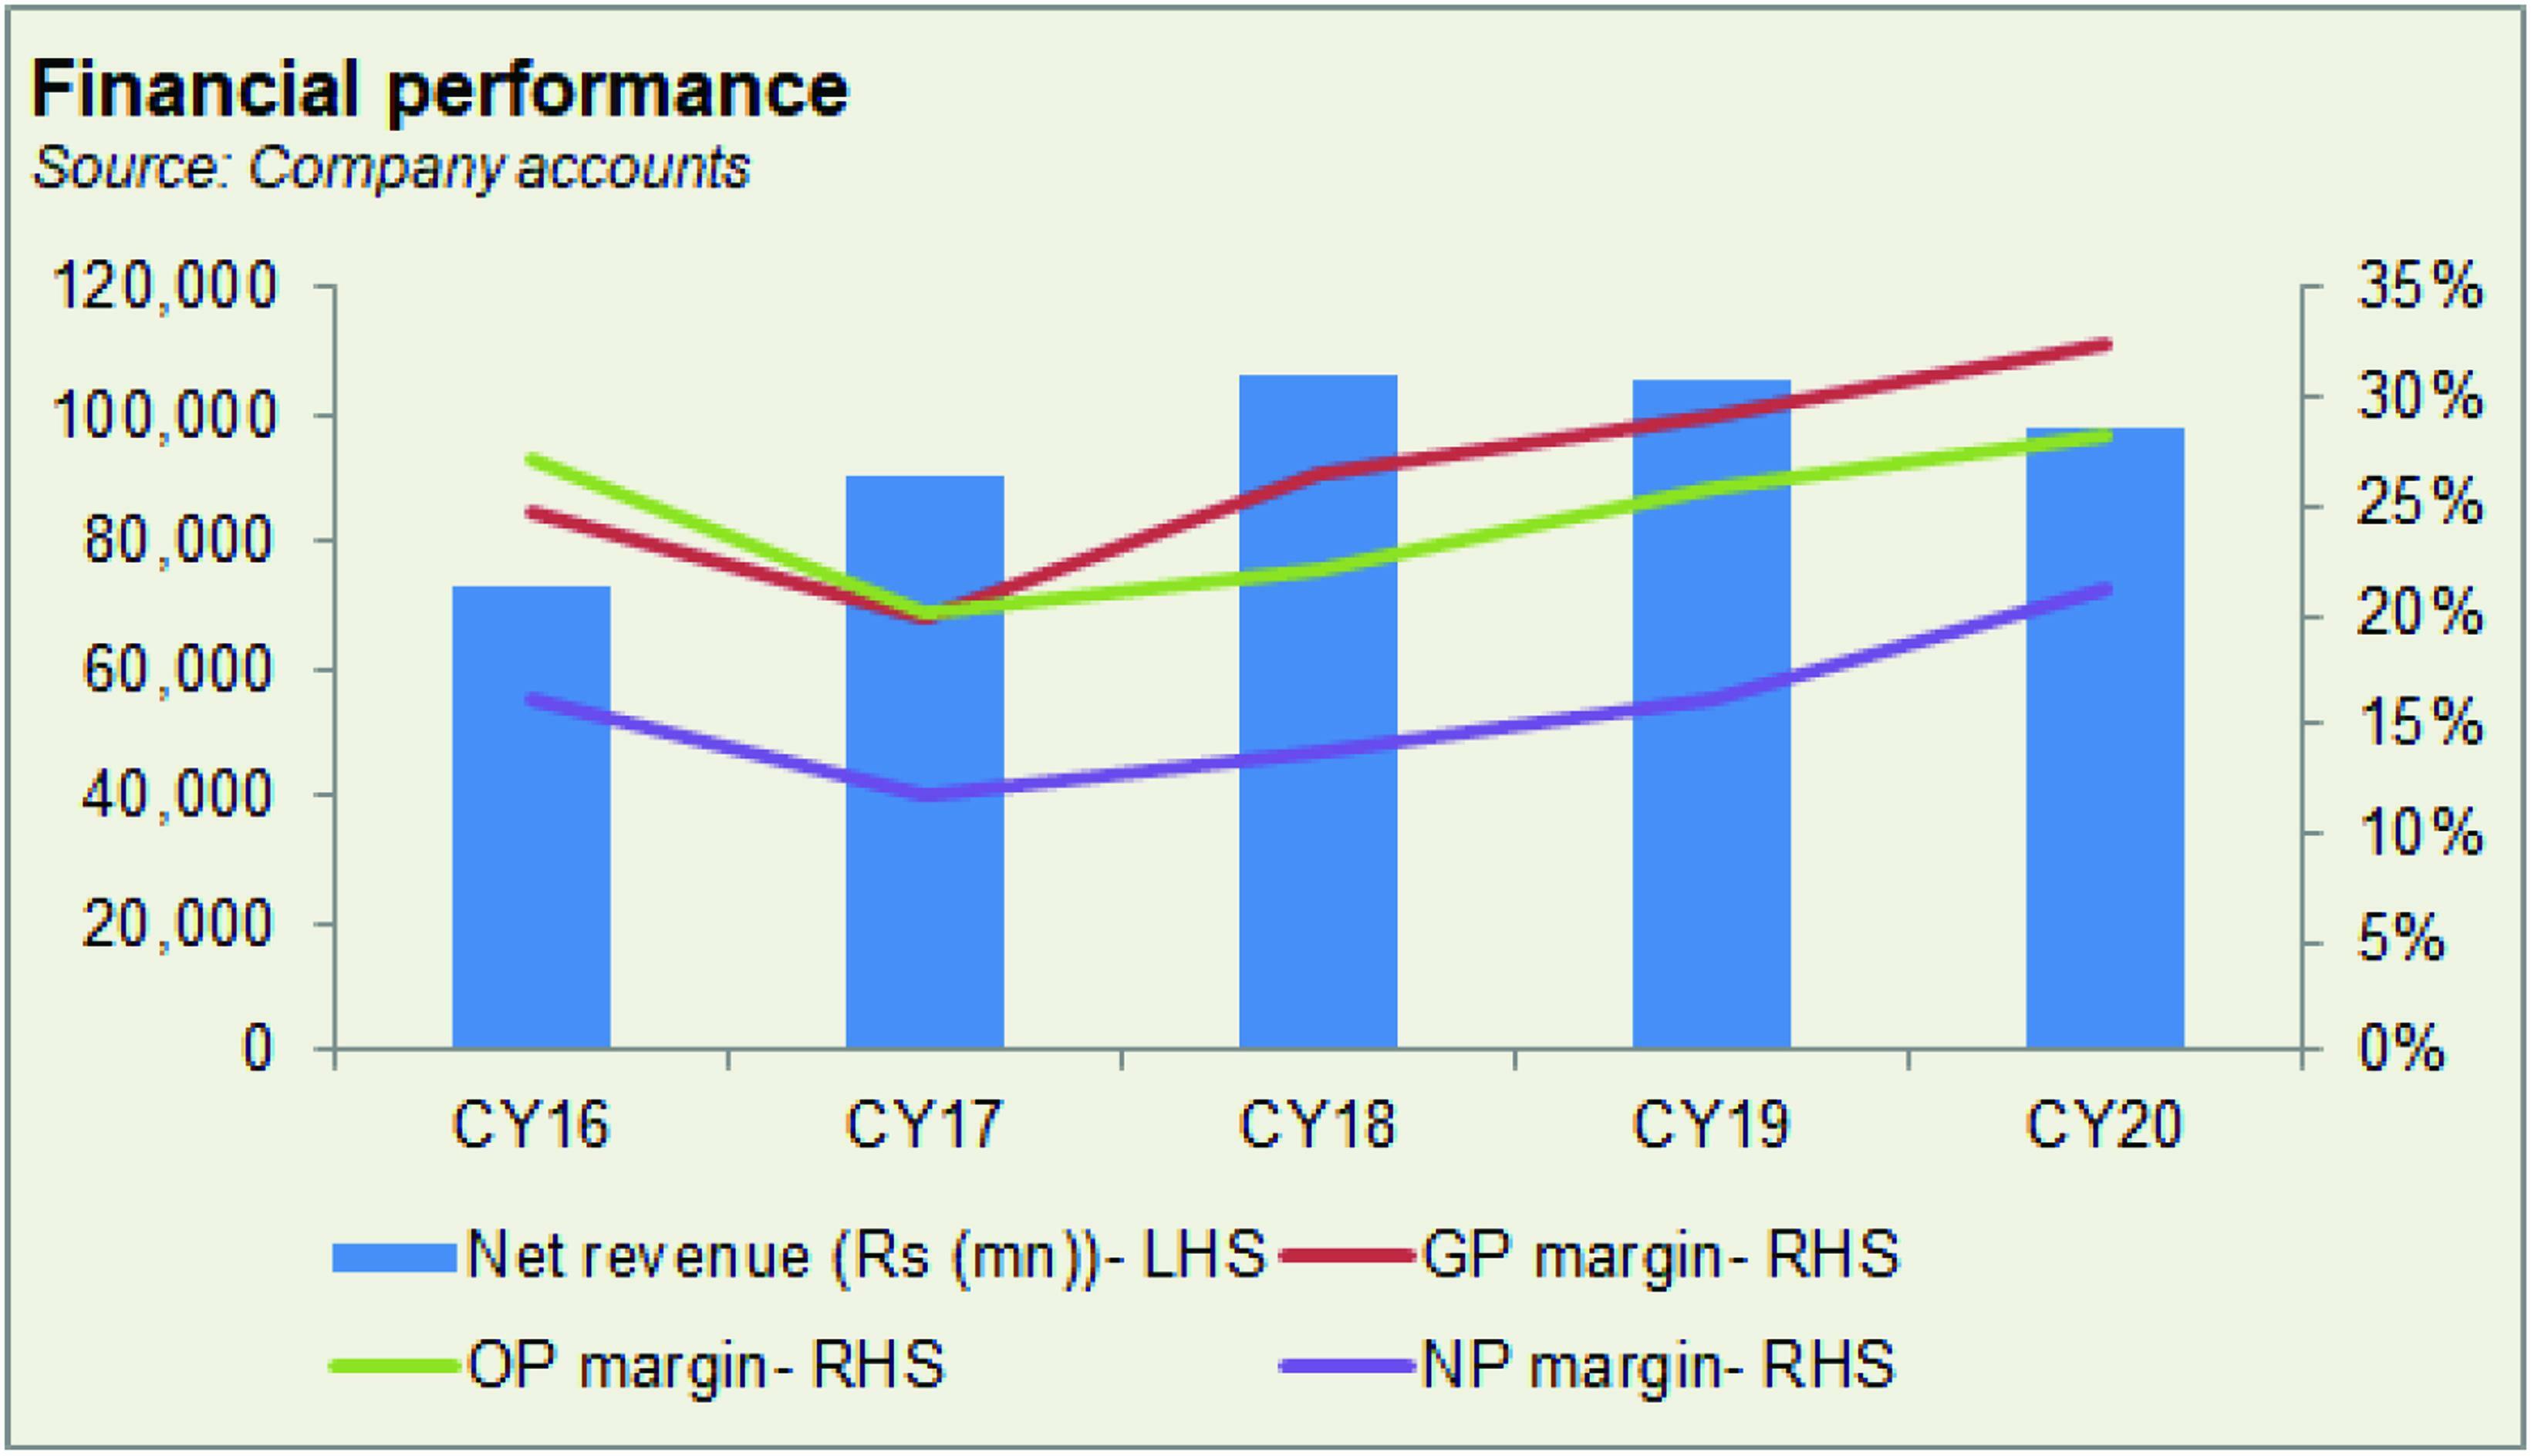
The company has mostly seen a growing topline, except for in CY16, and then more recently in CY19 and CY20 when it contracted. Profit margins, on the other hand, have been gradually on a rise in the last four years, since CY17.

After contracting in CY16, topline in CY17 registered a growth of 24.5 percent, taking revenue to cross Rs 90.7 billion in value terms. During the period, the company saw the highest urea offtake of 2,697 thousand tons, registering an 11 percent growth; DAP offtake was also recorded at its highest of 513 thousand tons that was 2.5 times higher year on year. this resulted in FFC’s DAP market share to grow to 21 percent, versus 9 percent in the previous year. However, due to production cost increasing to 80 percent of revenue compared to 75 percent in CY16, profitability shrunk; net margin was recorded at 11.8 percent, down from last year’s 16 percent.

During CY18, revenue grew by 16.8 percent, taking it to nearly Rs 106 billion for the year. This is attributed to the recovery in selling prices of urea after dampened market conditions witnessed in the last two years; the company saw the second highest all product offtake of 3,030 thousand tons during the year. With production cost reducing to 73.6 percent of revenue, coupled with the growth in topline, gross margin stood at 26.4 percent. However, the improvement in net margin was less pronounced due to the reduction in other income from over Rs 10 billion in CY17 to Rs 6.3 billion in CY18. This reduction was seen in government subsidy dividend from AKBL predominantly. Thus, net margin stood at 13.6 percent for the year.

Revenue in CY19 contracted marginally by less than 1 percent, thereby remaining close to Rs 105.8 billion in value terms. Sona Urea offtake was 2 percent lower year on year, at 2,467 thousand tons, while DAP offtake was at 237 thousand tons, lower than 480 thousand tons seen last year. This was due to low demand compared to the previous years. With a further decrease in production cost to nearly 71 percent of revenue, gross margin improved to 29 percent. In addition, other income grew largely due to income from conventional banks and dividend income from conventional mutual funds. This offset the increases in other expenses and finance costs, thus net margin was posted at 16 percent.
In CY20, the company saw the biggest contraction in revenue it had witnessed since CY16. Revenue fell below the Rs 100 billion mark. This was due to the decrease in selling prices of urea that, in turn, was a result of reduction in GIDC rates. However, in terms of volumes, Sona Urea offtake was higher year on year at 2,512 thousand tons, whereas DAP offtake was lower by 2 percent, at 233 thousand tons. The latter was due to limited product availability during the year. Production cost fell below 70 percent of revenue, allowing gross margin to improve to over 32 percent. This also trickled down to the bottom-line as net margin was also recorded at a higher 21.3 percent.
Quarterly results and future outlook
In the first quarter of CY21, topline was higher by 4.7 percent year on year due to increase in DAP turnover that was a result of escalating prices of imported fertilisers. Production cost, as a share of revenue, was also lower comparatively; combined with significantly higher other income, net margin was higher year on year at 26.9 percent.
In the second quarter, topline was marginally lower year on year, by 3 percent. This was due to controlled sales to unregistered dealers in order to avoid the adverse impact of GST. As a result, offtake for Sona Urea was lower at 1,131 thousand tons, versus 1,271 thousand tons in the same period last year. Production cost was again lower year on year, allowing gross margins to improve to 34.7 percent. But the unwinding of GIDC liability adversely impacted the bottom-line for the quarter. Thus, net margin was at a decreased 16 percent.

Revenue recovered in the third quarter as it was higher by 20 percent year on year due to increase in DAP turnover. This was a result of higher import prices. Production cost as a share of revenue was notably lower year on year at 62 percent, allowing gross margin to take off. With significant support from other income, net margin was also improved at 21.8 percent.
Despite the impacts of Covid-19, the company has managed to maintain and improve profitability. However, it has faced cash flow constraints as Rs 6.96 billion has been tied up in subsidy claims and Rs 16.67 billion in GST refundable.


Comments
Comments are closed.