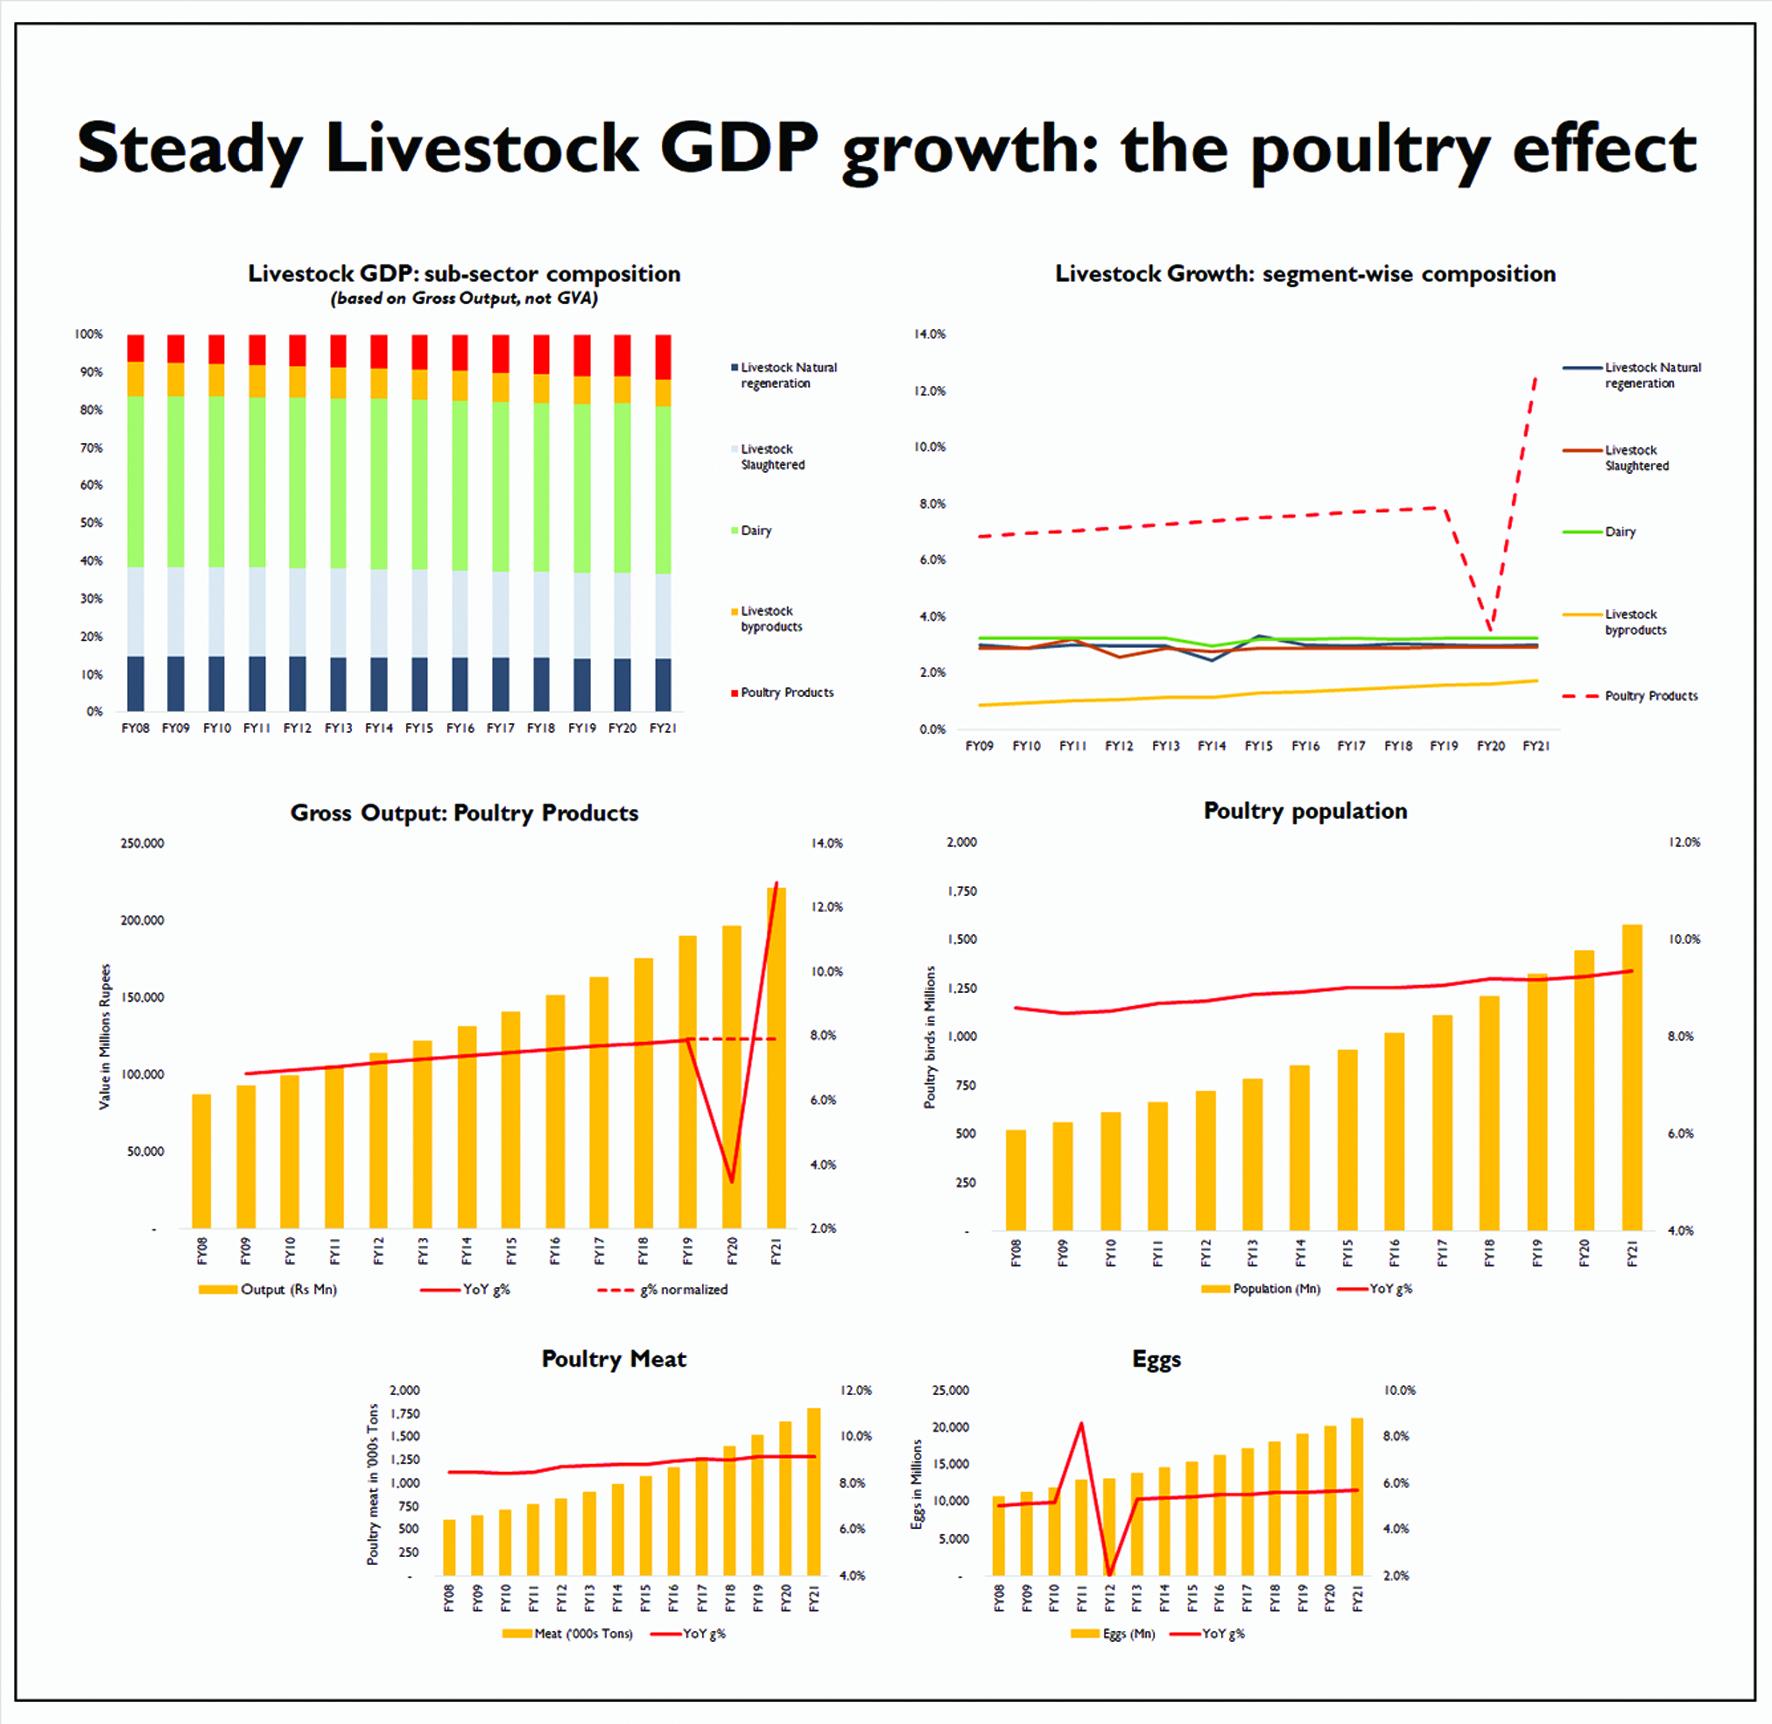
It is that time of the year again. Yesterday, SBP released its flagship annual economic publication – State of the Economy – for FY21, largely validating macro-economic statistics as published by Finance Ministry in its Economic Survey 2020-21 more than six months ago. Except the central bank follows a healthy habit of conducting analysis in greater depth; which serves as a treat for researchers in this statistically malnourished nation.
This year’s State of the Economy includes a snapshot of Gross Value Added (GVA) for Livestock sector, which raises some interesting questions but first a note of caution. SBP is a consumer of statistics, which means that it is only mandated to offer a review of economic indicators as supplied by PBS, National Accounts, FinMin and other government bodies. SBP does not conduct its own primary research so far as real sectors of the economy are concerned – and as a public sector organization – it does nor (cannot?) raise questions on the accuracy of these statistics. However, some anomalies may be obvious to readers, even on first glance.
Consider that the livestock sub-sectors such as milk, animals sold for slaughtering, etc show constant year-on-year growth rate in output for FY20 and FY21. Delve deeper, and one discovers that the constant-effect is attributable to the problematic methodology employed for livestock GDP estimation, which uses inter-census (Livestock Census 2006) growth rate between 1996 and 2006. These results in some interesting outcomes, such as highest average buffalo milk yield in Pakistan compared to six other regional countries!
It takes no rocket scientist to raise suspicion on the accuracy of this statistic, considering the elevated growth rate in dairy prices across the country for over a decade and highlights the urgent need for a fresh Livestock Census at national level, which has long been delayed. (This is of course without prejudice to GDP measurement techniques employed by National Accounts currently. After all, an inter-census growth rate serves as some basis for estimation, against using no methodology at all!)

But it’s the poultry segment GDP estimation that takes an even more interesting turn during FY21. According to SBP, gross output (value) of poultry segment grew at 12.8 percent during FY21 against just 3.5 percent last year. A segment output declining during pandemic year would normally not raise eyebrows, were it not for few other conflicting figures also supplied by GOP.
Remember, just like livestock (meat and dairy) segment, poultry output is also not measured on annual basis, but instead is estimated using statistical parameters based on Livestock Census 2006 and inter-census growth rate of 1996-2006. This means that poultry output (value) has also followed a neat pattern of constant year on year growth, except for the flood year when a one-time downward adjustment was applied on livestock GDP outturns.
Interestingly, poultry segment outturns as supplied by GOP in the Economic Survey indicate no deviation from this trend. According to the Survey, bird population registered growth of 9.4 percent; poultry meat of 9.2 percent; and poultry eggs of 5.7 percent, respectively, as they have every year since at least FY13. This is very much in line with other livestock segments, such as buffalo and cattle population, or milk output, which continued to grow at constant rates of 2.9 percent, 3.8 percent, and 3.2 percent respectively both in FY20 and FY21 (as in all previous years since FY12).
While the livestock (meat and dairy) segment GDP estimate follows in footsteps of constant quantity growth, poultry segment output follows diverging trends in value and volume. On one hand, poultry output (value) growth rate fell from its constant annual slope of 7.9 percent until FY19 to 3.5 percent in FY20 (and then rose to 12.8 percent in FY21), poultry volume continues to grow at constant rate across all years.
Things get even more interesting if you normalize the year on year growth rate of poultry output (value). Had the segment value grew at constant rate of 7.9 percent across all years between FY19 – FY21 rather than at varying rates, FY21 value would have landed at the same amount as it has today.
It seems the econometricians at National Accounts adjusted only poultry segment’s output downward during the pandemic year, to account for the perceived effects of economic contraction due to lockdown. But this fails to explain why the output volume – as indicated by poultry population, poultry meat, and eggs produced (and published by Economic Survey) – did not decline.
Moreover, while an argument could be made that poultry sector was indeed adversely impacted by pandemic and lockdown of commercial activity, it does not explain why similar adjustment were not applied to other livestock segments such as animal (beef and mutton) meat, or dairy products. Even more importantly, considering the abnormal volatility witnessed in broiler, eggs, and day-old chick prices during last fiscal year, there is little to no evidence to suggest that the poultry segment grew at a double-digit growth rate during FY21, as State of the Economy reports.
Will econometricians at PBS and National Accounts care to explain?


Comments
Comments are closed.