The rise in branchless banking (BB) segment mid-pandemic has been well-documented. However, the recent release of quarterly BB statistics (Jul-Sep 2021) by the State Bank of Pakistan (SBP) suggests a visible slowdown in the growth momentum of this vital digital payment segment. Let’s see if the apparent slowdown, both in uptake (number of accounts) and activity (scale of transactions) reverses itself in the subsequent quarters.
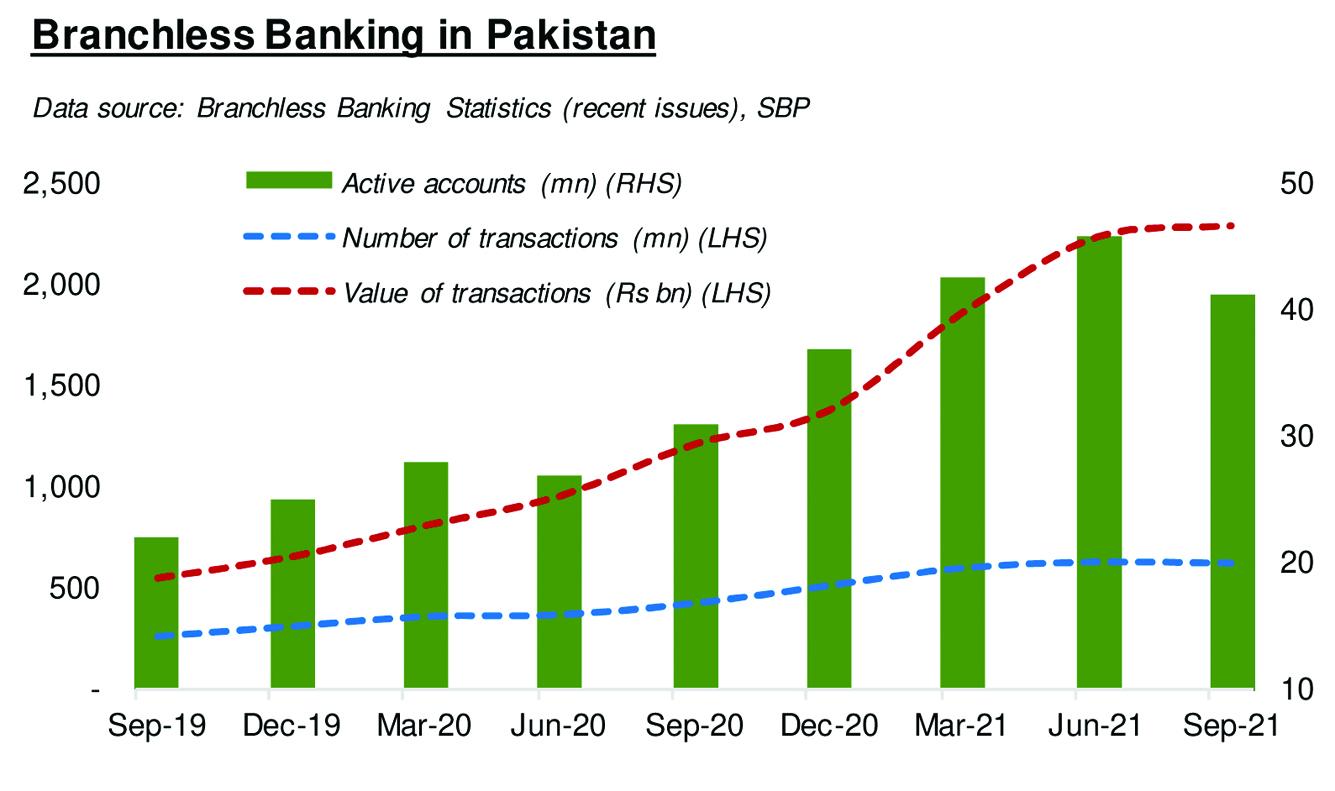
The SBP data show that the number of “active” BB accounts (or mobile wallets, aka m-wallets) had come down to 41 million at the end of September 2021, compared to 46 million at the end of June 2021. This 10 percent fall sits in contrast with 11 percent average quarterly growth during the pandemic. It is also the biggest quarterly decline in m-wallet tally since the pandemic began. (The term “active” here is the regulatory definition of an account that was opened or used at least once over previous 180 days).

There is, however, significant growth of 33 percent (an addition of 10 million) in number of active m-wallets between September 2020 and September 2021. It becomes even better on a slightly longer stretch. The fact that active accounts have nearly doubled in the two years ended September 2021 is remarkable, and the pandemic-era need for physical distancing did help in this regard. (The previous doubling of active m-wallets had taken two and a half years to reach 22 million in September 2019).
Effects of lower m-wallet activity are naturally evident in the transaction mix. During Jul-Sep 2021, some 617 million BB transactions (down 1% over previous quarter) worth Rs2.29 trillion (up 2% over previous quarter) were made. The quarterly performance looks subpar when compared to pandemic-era average quarterly growth of 13 percent in transaction volume and 23 percent in transaction value. Having said that, Jul-Sep 2021 yearly growth was still impressive: 46 percent for volume and 89 percent for value.

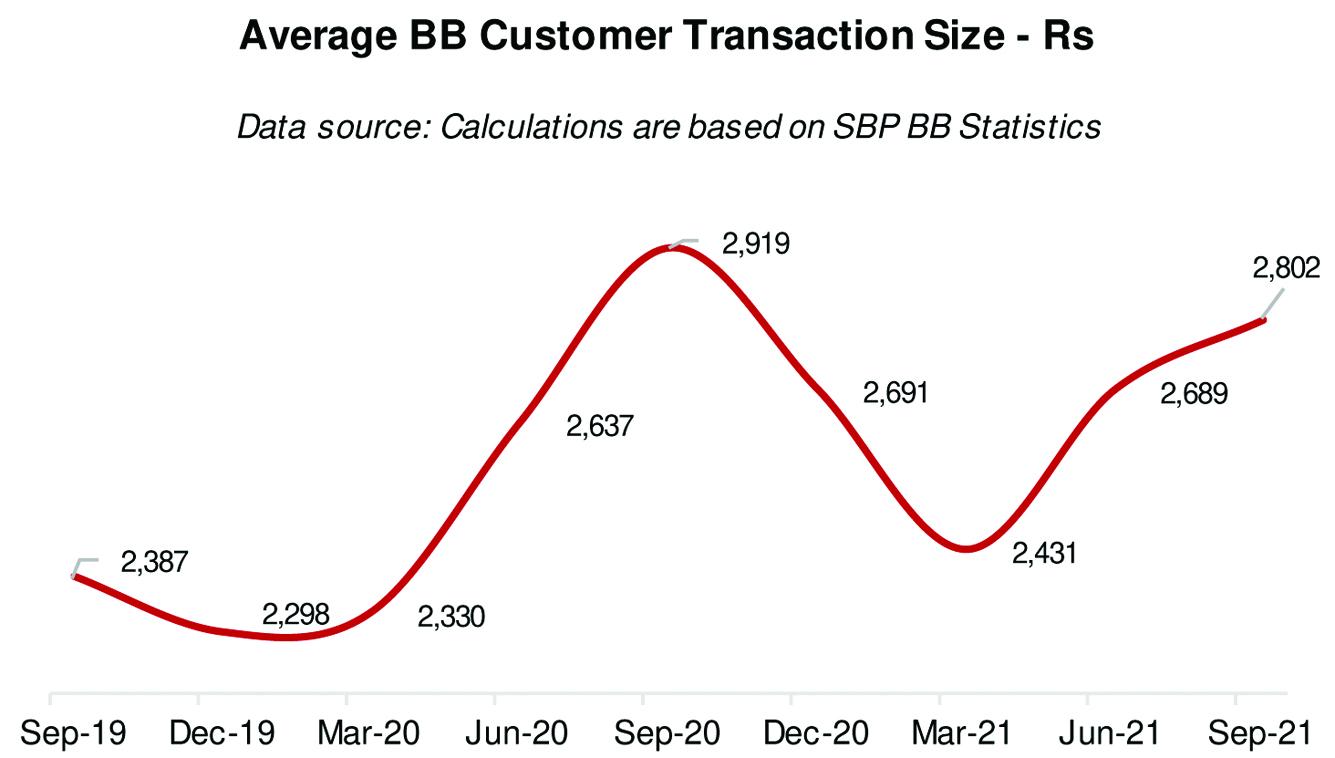
Have BB service providers maxed out the ‘early majority’ of users in addressable market? It isn’t clear, but there is a cue in rising average transaction size among BB customers. The average reached Rs2,802 per customer transaction during Jul-Sep 2021, showing growth of 20 percent compared to pre-pandemic quarters. (Transaction value growth has been almost double the level of volume growth amid pandemic). This could suggest that m-wallet users who are sticking around are making more use of this channel.
This still leaves service providers proving unable to retain millions of first-time BB users on their platforms. In Jul-Sep 2021, account activity ratio (active accounts as a percentage of total account) stood at 57 percent, down from 61 percent during previous quarter and slightly better than 54 percent in the year-ago period. Market players need to further improve account activity levels. And the regulator needs to have a more realistic criterion for active accounts – perhaps a 90-day limit for inactivity, if not a 30-day threshold?


Comments
Comments are closed.