The December 2021 import bill at $6.9 billion invited some congratulatory messages from the government circle. Yes, it is 13 percent down month-on-month. But it is also the second highest monthly import number ever. The trade deficit in 1HFY22 has doubled year-on-year to nearly $25 billion. The policymakers have so far attributed the massive surge in imports largely to the rising commodity prices. The policy actions that have followed have also echoed the same.
The Pakistan Bureau of Statistics (PBS) in its latest data release has shed more light on the import composition – breaking it further down with quantity and price. Recall that the central bank in the last monetary policy statement, had put “around 70 percent of this increase in imports……to the sharp rise in global commodity prices.” That observation always came with a caveat as it represented not more than 45-47 percent of total imports, duly acknowledged by the SBP.
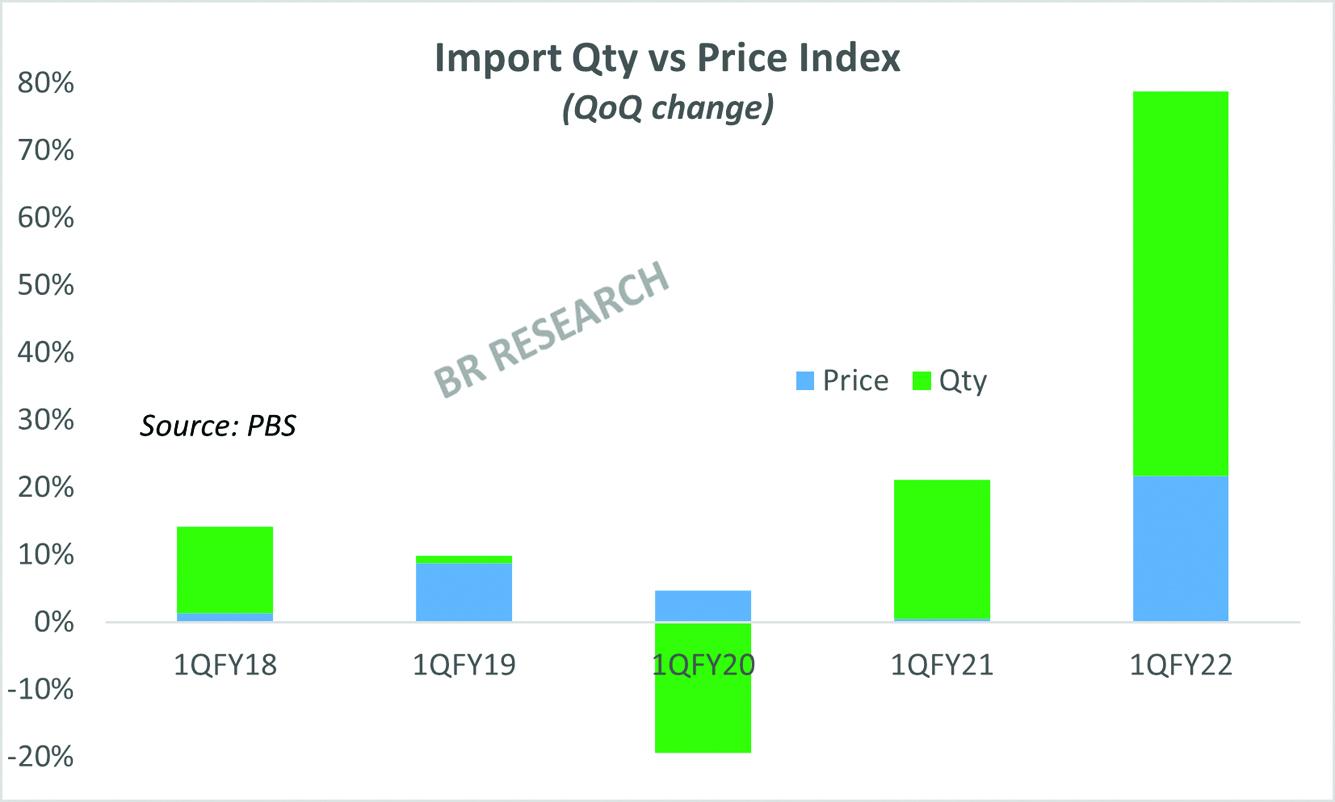
Keen watchers had always wondered if there is more going on with the other half, where the PBS does not provide quantity data for its advance monthly release. The index numbers of imports by quantum released by the PBS now allows further insight into the import composition. And that is a completely different story from what the monthly PBS data offers. The key takeaway is that the index for quantum of imports has gone up by a massive 57 percent year-on-year in 1QFY22 – easily the highest ever increase for any quarter.

There is meaningful impact of unit prices for sure, but that at 22 percent growth year-on-year pales in comparison to quantum of imports. This goes on to show the “other half” that the PBS chooses not to reveal in its monthly advance releases, is entirely driven by volume. So much so, that it overturns the picture painted by the half where quantum data is available for public consumption. Mind you, the “other half” does not include vaccines, in case you were wondering.
In absence of detailed HS code data, one can only draw conjectures if the massive quantum driven import growth is one that can be checked. Or does it even need to get checked. For instance, machinery and transport group has witnessed 200 percent year-on-year jump in quantity index value for 1QFY22. Now this does not become part of the wider observation, which then feeds into key policy decisions, such as the monetary policy.
This should be a moment to pause and ponder for the PBS whether it will be better for everyone, from the policymakers to researchers and commentators, that richer data is provided on monthly basis. What the quantum index values tell surely would have led to an altered policy response and preparedness than what actually transpired. Surely when the PBS can offer the index values, it must be in possession of actual quantities by categories, and that would only make life easier for everyone involved. Half-baked data would lead to half-baked decisions at best, and ill-informed and wrong ones at worst.


Comments
Comments are closed.