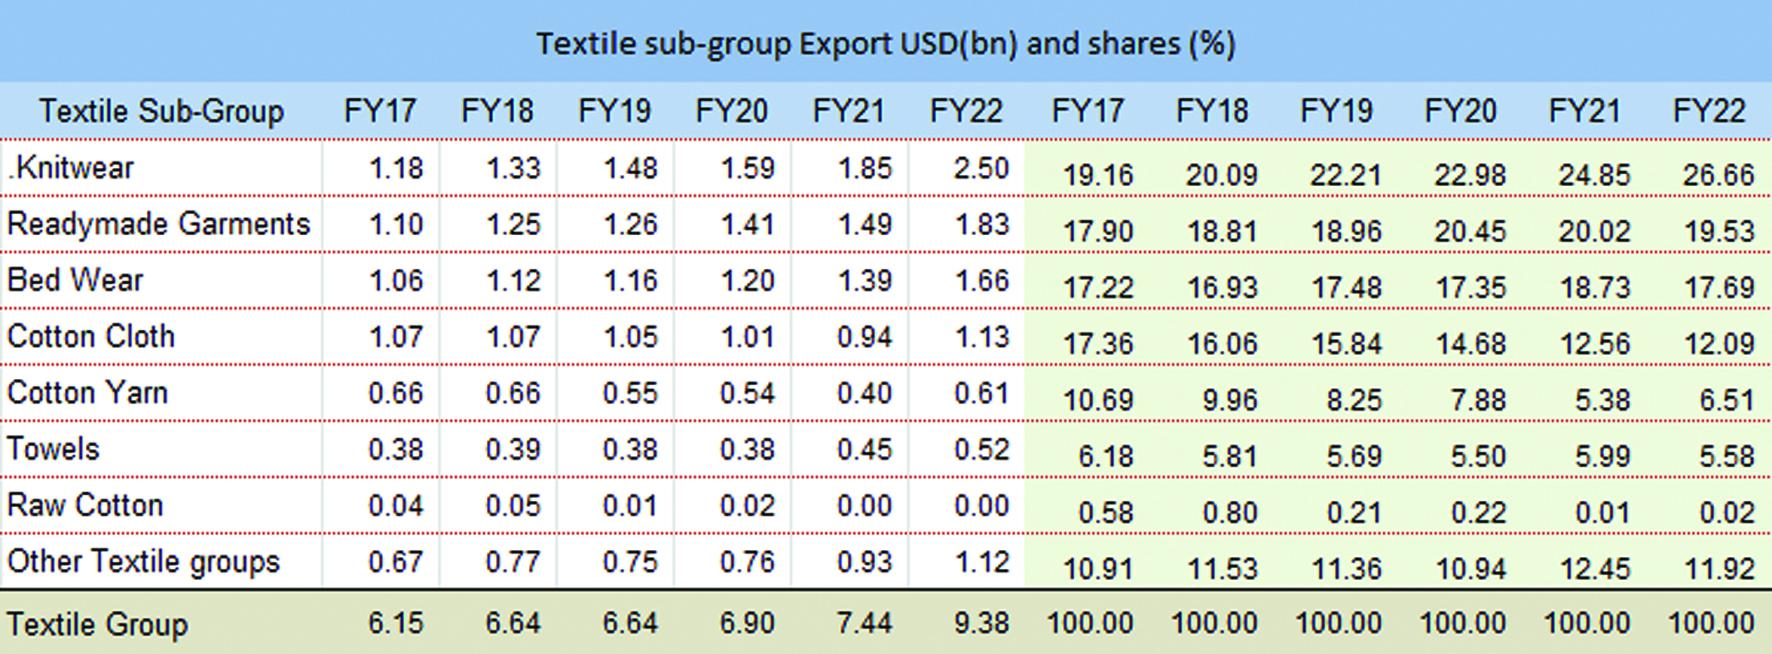
Textile exports in Pakistan are on the rise – 26 percent increase to $9.4 billion in the 1HFY22. The growth in exports has continued in January to $1.55 billion – up by 17 percent YoY as has been indicated by government officials. ATPMA is celebrating this achievement which the commerce minister has attributed to a shift in export orders from India and Bangladesh to Pakistan. It’s heartening to witness this growth, however, this growth in textile exports is not confined to Pakistan only. In fact, the textile exports in Jan 22have increased by a whopping 41 percent YoY in Bangladesh, meanwhile the growth was 28 percent in 1HFY22.
The growth in orders across this region indicates an increase in demand for textile from the west. Pakistan is therefore not the only country to benefit from this trend. Export value for textile has also improved due to increase in price. It is difficult to identify if the growth for textile exports is a consequence of increase in price or volume. The data in LSM and PBS is inconclusive in this regard it is therefore safe to assume that both factors are responsible.
It is difficult to ascertain whether there is a shift of exports from regional countries to Pakistan. Seeing the Pakistan textile exports trend in the past three years, one thing is clear that there is decline of exports of yarn and cloth (low value added) and significant growth in knitwear and garments (high value added). That is a good omen as more dollars are being fetched per ton of textile exports due to the higher dependence on value added segment.

The factors contributing to the growth of exports are both global and local. The industry is shifting from a reliance on China and that is giving space for Pakistan exports to grow. Currency adjustments and energy subsidy to exporters are also helping in the growth of exports. According to an IGC study, there is no statistical evidence that the textile exports have grown due to gas and electricity subsidies. However, there is a significant increase in domestic sales. This implies that spinners and weavers are benefiting from to subsidies and that is fueling value addition locally. That change might be reflecting in the form of increase in exports of knitwear and garments.
The gas subsidy has ended, and supply of gas has been erratic in winters. This change has so far not had any impact on export volume. But there are production losses which may cause a minor dent in textile exports in the next couple of months.
To circumvent any potential loss, it is important to leverage the new investment -major share of both LTFF, and ERF is enjoyed by the textile industry. There appears to be no dearth of demand. Pakistan can take share from Bangladesh. The cost of transportation is cheaper from Pakistan. The cost of container from Bangladesh is approximately $18,500 compared to $12,500 from Pakistan. This difference may compensate for the energy cost disadvantage.

Gas subsidy is demanded by spinners and weavers. They have expanded. It is in their interest to sell what they produce. For the value-added segment the freight advantage vs. Bangladesh is even bigger. If spinner sells yarn to Bangladesh, cargo cost is $8,000 and cost of shipment to US is $18,500. The product can reach US in $12,000 from Pakistan. Pakistan therefore has a competitive advantage vs. Bangladesh to grow export volume.
To continue growth trajectory in textile exports, government needs to ensure uninterrupted energy supply as both electricity and gas markets are controlled by the energy ministry. It is important to speed up private supply in the LNG market. One (to be) terminal is in advanced stage of approval. Then there are players interested in virtual supply. Concurrently, it must work on doable solutions for wheeling. Here DISCOs are probably not interested. Government should work on privatizing DISCOs.
These are must do steps. The external account stability can only be achieved by enhancing exports and making domestic industries competitive. The energy price is not. Reducing the footprint of government in the energy market would significantly reduce the inefficiencies. There is supply available at low fuel cost. Unfortunately, creativity and imagination to create a workable solution is missing.


Comments
Comments are closed.