Shakarganj Limited (PSX: SML) is a public limited company established in 1967 under the Companies Act, 1913 (now Companies Act 2017). The company manufactures purchases and sells sugar, biofuel and yarn.
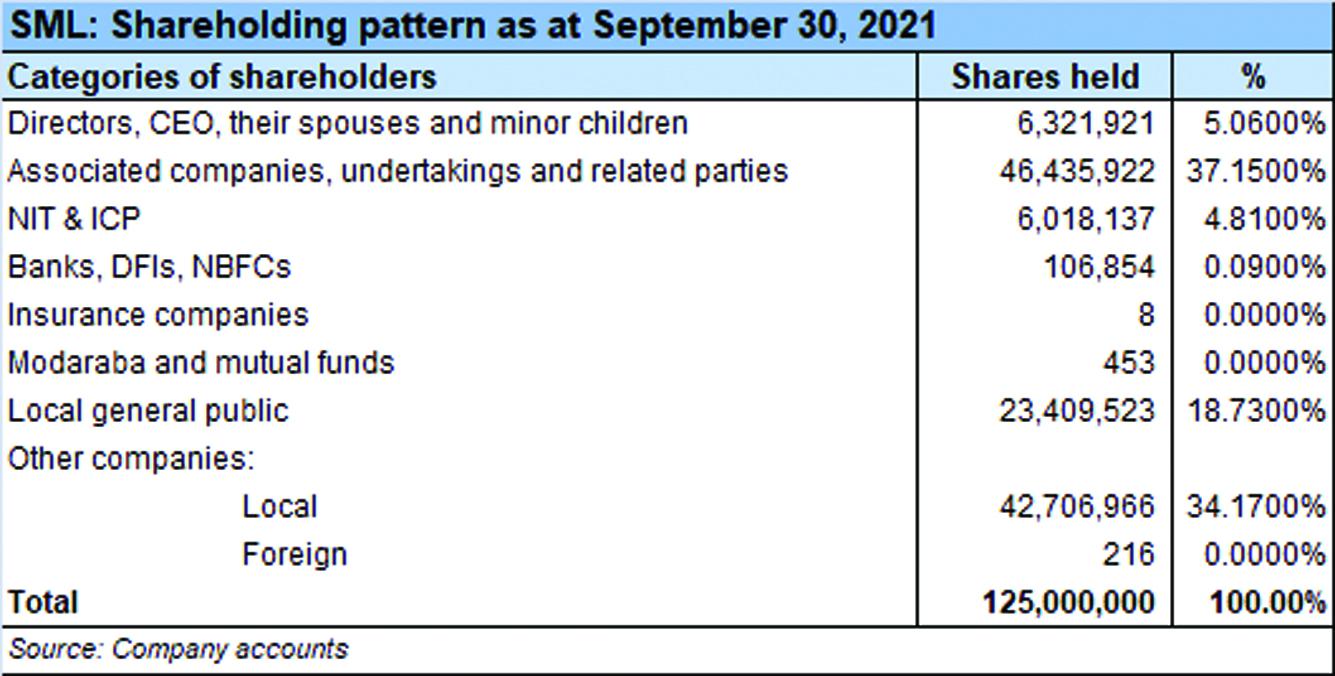
Shareholding pattern

As at September 30, 2021; over 37 percent shares are held with the associated companies, undertakings and related parties, followed by 34 percent by the local companies. The local general public owns close to 19 percent shares, while the directors, CEO, their spouses and minor children own about 5 percent shares. The remaining roughly 5 percent shares are with the rest of the shareholder categories.
Historical operational performance
Shakarganj Limited has experienced a fluctuating topline over the years, whereas profit margins, in the last six years specifically, have followed a declining trend after MY17.
In MY17, revenue more than doubled year on year in value terms as it grew from Rs 4.4 billion in MY16 to Rs 11.3 billion in MY17. This can be attributed to higher volumes as the company produced 144,460 metric tons during the year compared to 45,707 metric tons in MY16. This in turn can be attributed to an early crushing season due to a rich sugar cane crop. On the other hand, with a reduction in cost of production as a share in revenue at over 94 percent, compared to costs exceeding revenue last year, the company posted a positive gross margin of 5.8 percent for the year. This also trickled down to the bottomline with net margin at nearly 2 percent. The improvement in net margin was less pronounced due to reduction in other income and share of profit from associates coupled with an increase in selling expenses as a share in revenue.

In MY18, topline contracted by almost 35 percent to reach Rs 7.4 billion. Sugar production fell to 61,634 metric tons whereas selling prices also remained depressed that contributed to lower revenue. However, production cost was only marginally higher at 95 percent; therefore gross margin remained close to 5 percent. But with a further reduction in other income combined with a relatively higher taxation, the company incurred a loss of Rs 14 million.
Revenue contracted by 15.5 percent in MY19 to reach Rs 6.2 billion. Revenue from the sugar division alone was lower by almost 20 percent. The company began its crushing late at end of December, and ended by March, which meant a short season in addition to depressed selling prices. Sugar production was also lower at 49,016 metric tons of sugar at a recovery rate of 10.13 percent. The recovery rate was better due to quality sugar cane. With loss of revenue and costs intact, the company was unable to cover its cost of production that resulted in a gross of Rs 26 million. Moreover, with selling, administrative and finance expense escalating as a share in revenue, combined with a significant reduction support from other income and share of profit from associates, the loss increased to Rs 729 million for the year.

Topline grew marginally in MY20 by over 2 percent. The company began its crushing season a month earlier than it did in MY19. As a result, it crushed 884,724 metric tons of sugar cane compared to 484,762 metric tons. Looking at the sugar division particularly, local revenue had witnessed an increase of over 85 percent. But it was accompanied by a more than corresponding rise in costs thus incurring a gross loss for the division. There was also a marked increase in administrative expense of the division that eventually aggravated net loss for the sugar division to Rs 812 million. The overall net loss for the year was recorded at Rs 998 million as share of loss in associates increased to Rs 539 million compared to a profit of Rs 5 million.

In MY21 revenue increased by nearly 43 percent to reach Rs 9 billion, which is the highest seen in the last seven years. The company began its crushing ten days earlier than last year. It managed to crush 1,006,075 metric tons versus 884,724 metric tons. However, growers were unwilling to sell at the rate fixed by the provincial government, and due to the early start to the crushing season, a price war ensued. As a result, the sugar division incurred a gross loss of Rs 556 as it was unable to cover costs despite the growth in revenue. With further expenses incurred and a significant drop in other income to Rs 205 million compared to Rs 804 million in MY20, net loss for the company overall grew to almost Rs 1.4 billion.
Quarterly results and future outlook
Revenue in the first quarter of MY22 was lower by 27 percent year on year with 262,951 metric tons of sugar cane crushed compared to 316,056 metric tons seen in the same period last year. Moreover, cost of production exceeded revenue due to price wars that raised the gross loss for the period to Rs 266 million compared to Rs 129 million in 1QMY21 that further grew to a net loss of Rs 383 million for the year. Average sugar cane cost grew to Rs 253 per 40kg versus Rs 231 per 40kg in the corresponding period last year.

The company expects crushing to increase for the rest of the season; however, with continuously rising cost of production, profitability can be uncertain.


Comments
Comments are closed.