Gul Ahmed Textile Mills Limited
Gul Ahmed Textile Mills Limited (PSX: GATM) was set up in 1953 as a private limited company. Two years later, in 1955, it was converted into a public limited company. The company manufactures and sells textile products and it is a subsidiary of Gul Ahmed Holdings (Private) Limited.
Shareholding pattern

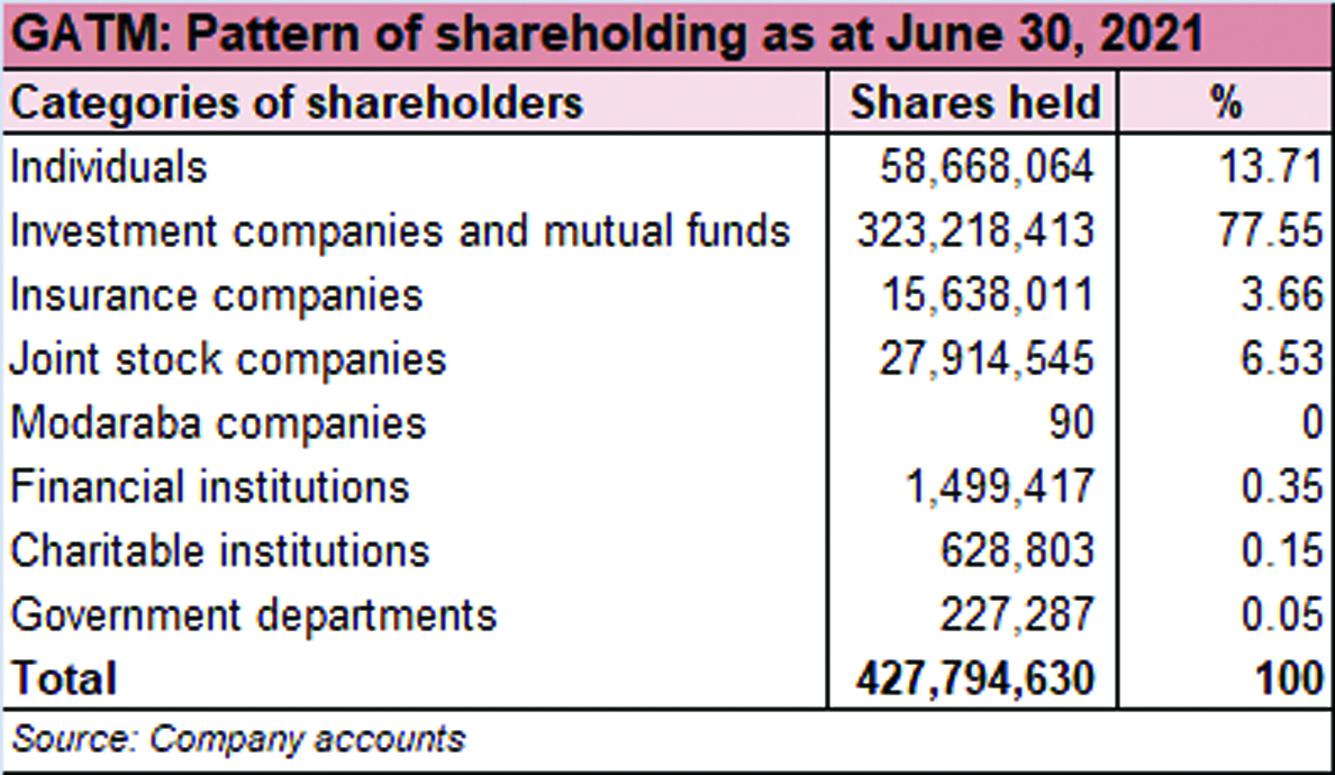
As at June 30, 2021, over 77 percent shares are held under the category of investment companies and mutual funds. Within this, 67 percent shares are owned by Gul Ahmed Holdings (Private) Limited. The directors hold less than 1 percent shares in the company, the majority of which are held by Mr. Mohomed Bashir, the Chairman of the company. About 13.7 percent are categorized under “individuals” while the remaining roughly 9 percent shares are with the rest of the shareholder categories.
Historical operational performance
Since FY10, the company has primarily seen a growing topline with the exception of FY12, FY16 and more recently in FY20. Profit margins in the last six years have been more or less stable except for in FY20 when they declined, before improving again in FY21.

In FY18, topline grew by 13 percent to reach Rs 45.3 billion in value terms. Both export sales and local sales registered increases by 9.3 percent and 20.5 percent, respectively. As noted by the higher growth in local sales, the company had witnessed higher demand in the domestic market. Overall, for the industry as well, exports increased by 8 percent to reach Rs $13.5 billion. Thus, the higher revenue for the period allowed gross margin to increase to 20.5 percent from last year’s almost 18 percent. With higher income also providing support to the bottomline, mainly coming from foreign currency exchange gain, net margin rose to 4.6 percent for the period.

Growth rate in revenue at over 26 percent in FY19 is the highest seen since FY12. Topline crossed Rs 57 billion which is the highest seen since FY10. Export sales registered a growth of 12.3 percent while local sales grew by almost 51 percent. The domestic market continued to generate higher demand, however, the cost of production at 79 percent of revenue kept gross margin flat at close to 21 percent. Additionally, the company earned Rs 1.1 billion in other income that raised net margin to an all-time high of 6.3 percent. Although finance expense also increased to consume 2/6 percent of revenue, it was offset by the unprecedented rise in other income.

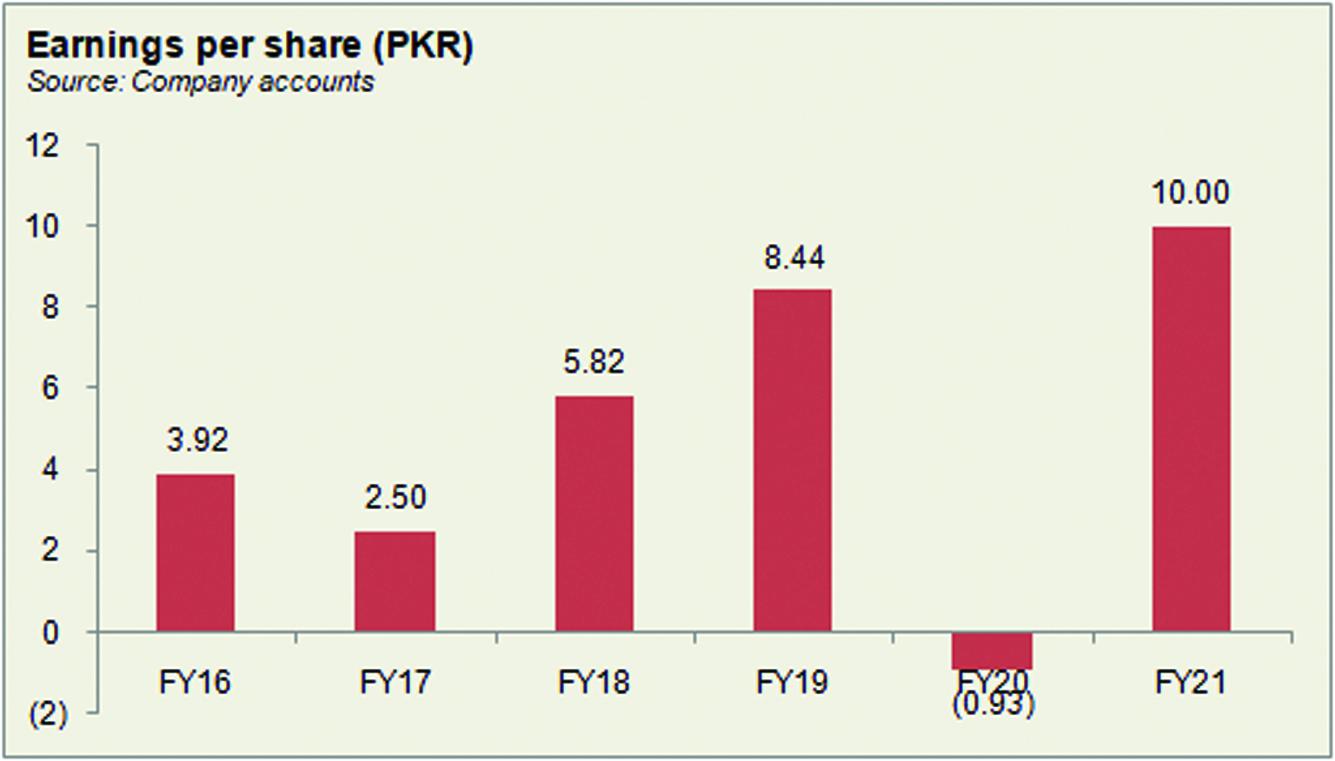
After seeing positive growth rates for three consecutive years, revenue in FY20 contracted by nearly 6 percent to fall to Rs 53.9 billion. While export sales continued to increase, by 6 percent, local sales saw a decline by 21 percent. Majority of this decrease was seen in the third quarter of FY20 as the Covid-19 pandemic led to nation-wide lockdowns and the company’s operations shut down for two months. There were also delays in shipments as Covid-19 had a global impact. This was followed by the month of Ramadan that already experiences low productivity. Therefore, gross margin reduced to 16.8 percent. Coupled with this was an escalation in finance expense combined with a reduction in revenue that was unusually higher in the previous year. Thus, the company posted a net loss of Rs 479 million for the year.

In FY21, topline saw the highest revenue growth at over 60 percent to reach over Rs 86 billion. Export sales increased by 59 percent while local sales increased by 62 percent. This was on the back of receiving significant volumes of export orders. Therefore, gross margin improved to 19.5 percent. However, the improvements in operating margin at 9.8 percent and net margin at 5.9 percent were more pronounced due to decrease in operating expenses as a share in revenue along with an increase in other income that more than doubled in value terms, during the year. The increase in other income came from multiple sources: remeasurement of government grant, development cess and a foreign currency exchange gain. Thus, the company posted an all-time high net profit of Rs 5 billion.

Quarterly results and future outlook
Revenue in the first quarter of FY22 was higher by almost 24 percent year on year. As business and economic activities resumed, the company saw improvements in export orders as well as local orders. This also trickled to higher profitability year on year despite the increases in cost of inputs with a net margin of 4.5 percent recorded for the quarter compared to 3 percent in the same period last year. Overall, the industry also saw a 27.4 percent growth in textile exports during 1QFY22.

The second quarter also saw topline higher year on year, by 20 percent. Both local sales and export sales registered increases. However, due to the inflationary pressures, currency fluctuation, and increases in costs of input, cost of production grew to over 83 percent of revenue, versus 81.5 percent, thereby reducing profitability year on year. However, net margin saw an improvement on the back of a significant reduction in distribution and administrative expenses. Thus, cumulatively, net margin was higher at 7 percent in 1HFY22 compared to 4.25 percent in 1HFY21. While cost of inputs such as oil and gas prices continue to pose a threat to the profitability, the company plans to combat that via timely purchases of raw materials and technological advancements to further enhance its financial performance.


Comments
Comments are closed.