Engro Polymer and Chemicals Limited (PSX: EPCL) was established in 1997 under the repealed Companies Ordinance, 1984 (now Companies Act, 2017). It is a subsidiary of Engro Corporation Limited. The latter is a subsidiary of Dawood Hercules Corporation Limited. Engro Polymer and Chemicals manufactures, markets, and sells Poly Vinyl Chloride (PVC), Vinyl Chloride Monomer (VCM), caustic soda and other chemicals.
Shareholding pattern

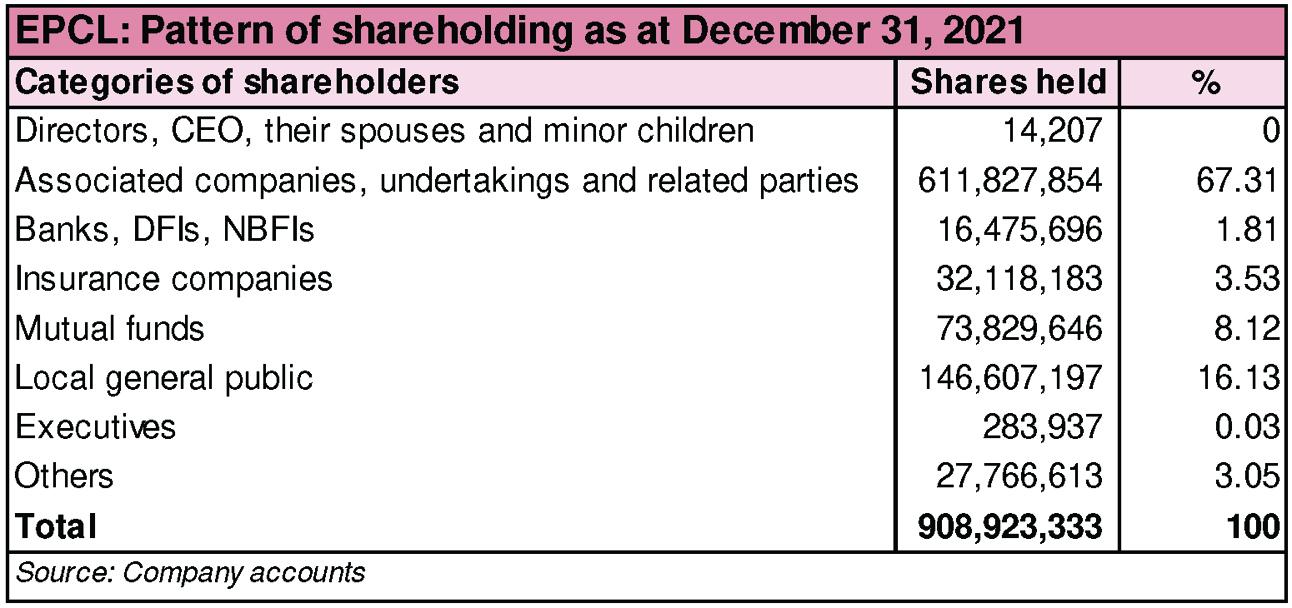
As at December 31, 2021, over 67 percent shares are held under the associated companies, undertakings and related parties. A major shareholder in this category is Engro Corporation Limited that owns over 83 percent shares. The local general public holds 16 percent shares followed by eight percent shares held under mutual funds. The directors, CEO, their spouses and minor children own less than zero percent shares while the remaining over eight percent shares are with the rest of the shareholder categories.
Historical operational performance
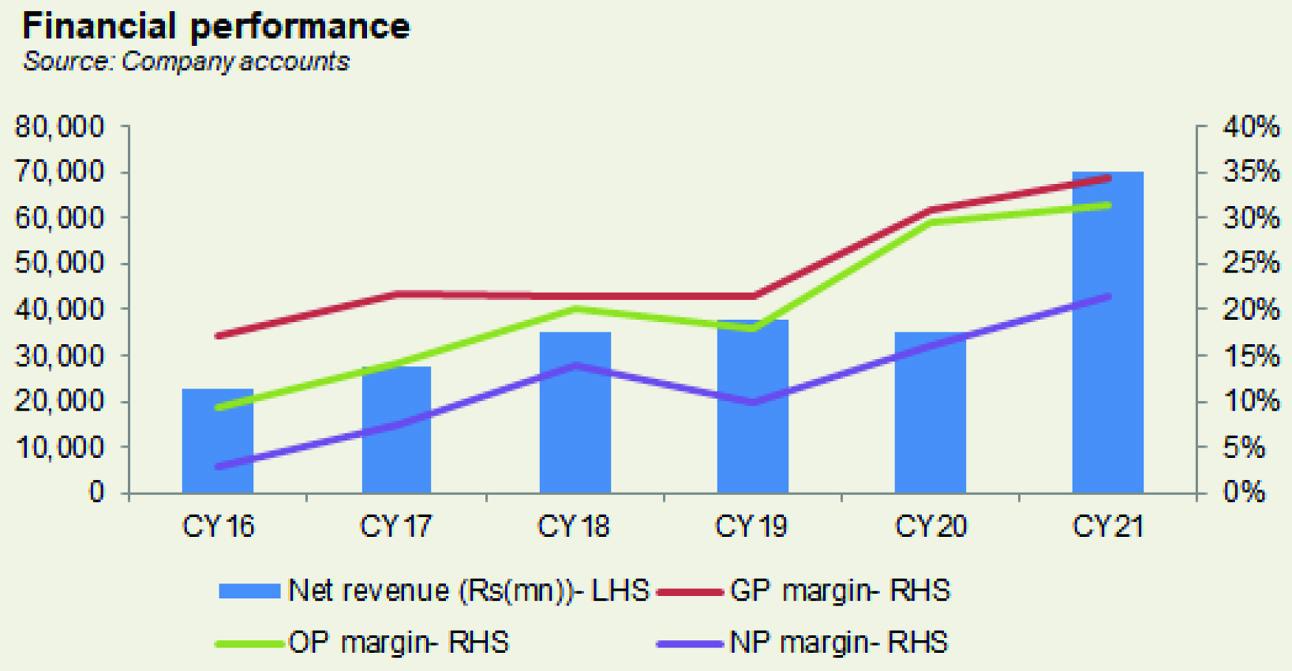
The company has largely seen a growing topline since CY07, with the exception of a few years. Profit margins, in the last years particularly, have been following an upward trend.

In CY18, revenue grew by over 27 percent to cross Rs 35 billion. This was a result of de-bottlenecking of PVC/VCM. In addition, there was sufficient demand in the market that was encouraged by the expansion of product utility to include PVC foam board and wall panel that saw double-digit growth. Previously, use of PVC was limited to pipes and fittings. Cost of production remained more or less stable at 78 percent of revenue, keeping gross margin also close to over 21 percent. However, net margin reached to its highest thus far at almost 14 percent due to significant support from other income that was recorded at over Rs1 billion. This was due to an insurance claim.

Revenue in CY19 grew by 7.3 percent. This was despite a six percent decline in domestic PVC volumes and four percent in caustic volumes. Demand from the construction sector was also relatively low due to a general challenging economic environment with inflationary pressures. As a result, the company also looked towards different avenues for usage of PVC to reduce reliance on construction sector. While gross margin was mostly stable at around 21 percent, net margin fell to 9.8 percent due to an escalation in other expenses and finance expense. The latter was due to higher interest rates.

In CY20, revenue contracted by 6.6 percent. This was attributed to a drastic fall in international prices in the PVC market in the first half due to decline in demand. There was some recovery in the second half of the year as countries focused on construction activities. With cost of production down to its lowest of 69 percent thus far, gross margin reached a high of 31 percent. Despite the escalation in finance expense that consumed 6.2 percent of revenue, the higher gross margin trickled to the bottomline that was also recorded at its highest thus far of Rs 5.7 billion while net margin stood at 16 percent. This was due to considerable support from other income that again crossed Rs1 billion, sourced primarily from income from financial assets.

Revenue almost doubled year on year in CY21 to reach an all-time high of over Rs 70 billion. This was attributed to an increase in PVC sales volumes by 28 percent and caustic volumes by 12 percent. A further boost in revenue was also brought about by an increase in PVC prices by 52 percent year on year. With production cost further down to 65.7 percent of revenue, gross margin reached a peak of 34.3 percent. This also trickled to the bottomline that was supported by a decline in finance expense to consume 2.7 percent of revenue. Thus, net margin stood at 21.6 percent of revenue and net profit too reached a peak at Rs 15 billion.
Quarterly results and future outlook

In the first quarter of CY22, revenue was higher by 47.6 percent year on year. This is attributed to a positive buying sentiment in the domestic PVC market. The latter also saw a volumetric increase of 18 percent on a quarter-to-quarter basis in 1QCY22. Moreover, international PVC prices had been declining until the second half of February before rising again due to supply tightness as well as demand in the downstream sector. However, despite the gain in topline, profitability remained lower as noted by a net margin of 20.4 percent in the current period compared to 26.46 percent in the same period last year. This is due to rising cost of inputs that raised the cost of production. Given the expectation for PVC prices to remain firm and the company’s ability to increase volumes, the second quarter may continue to see a better topline, but profitability remains uncertain due to geopolitical tensions and China seeing a resurgence of Covid-19.


Comments
Comments are closed.