

That Pakistan’s rice exports are all set to decline massively in the ongoing fiscal now appears to be a foregone conclusion. Earlier this month, this space highlighted USDA’s revised assessment that rice exports out of Pakistan may decline by as much as 20 percent during marketing year 2022-23, on the back of flood-hit disaster in Sindh and Balochistan which led to substantial losses of non-basmati crop. (For more, read: “Rice stocks: what does bank borrowing suggest”, by BR Research published on Nov 11, 2022).
This assessment brought a strong response from rice export players, who suggested that higher basmati exports shall come to the rescue. Market players – including some REAP members – are of the view that basmati prices have escalated by as much as 55 percent in value compared to the 2021-22 marketing year.
Substantially higher prices from traditional markets where basmati demand is historically well entrenched can indeed help in compensating the forgone export receipts from coarse variety (albeit partly), which fetches less than half the price of basmati, but is over five times the volume.
For reference, consider if coarse rice exports drop by USDA forecast volume of 0.8 million metric tons (MMT), export receipts would decline by $360 million (average unit price unchanged at c. $450 per ton). In contrast, if basmati prices in the international market maintain their current trajectory and rise by an average of one-third over last year, export revenue would rise by c. $250 million, assuming volume exported remains unchanged.
However, this rudimentary analysis by rice market players seems to miss two key elements: namely, market share and pricing power. Pakistan is a small player in the international coarse rice market, meaning that a million tons less rice exports by this nation would make little difference to 50MMT plus coarse rice annual trade. Lost exports from Pakistan may just as easily be compensated by other players whose market share is several times that of ours, such as India, Viet Nam, and Thailand. Coarse rice prices are also far more stubborn, struggling to rise beyond the +/- 10 percent range of $400 per metric ton in absence of major supply shocks. Lower Pakistani coarse exports alone may not cut it.
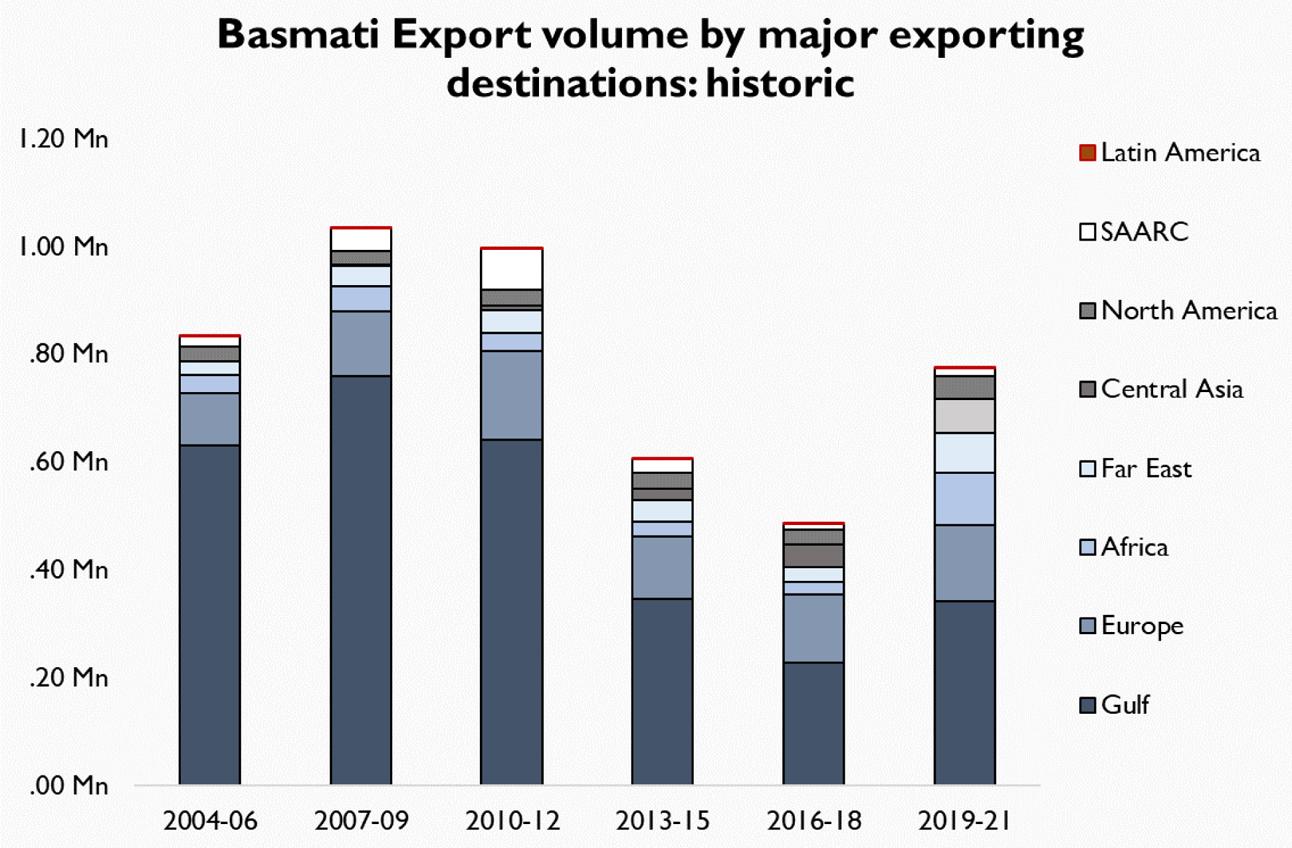
On the other hand, Pakistan is only one of the two notable players in the global basmati trade, splitting market share with neighboring India at 20-80. Although global basmati trade has averaged at 5MMT over the past many years, demand for this premium aromatic variety is highly price sensitive. Although it is correct that basmati demand is well-entrenched in exporting destinations such as Gulf, Europe and North America; India dominates each of these markets due to its greater pricing power.

But why does that mean Pakistan may struggle to benefit from higher prices? Two factors. First, Pakistan’s share in entrenched markets has been falling over the years, both in absolute and relative terms. For reference, Pakistan’s basmati exports between 2019-21 to Gulf countries was less than half of the volume exported during 2007-09.
Two, even in recent years when Pakistan has managed to maintain its overall market share in the basmati export market, it has continued to shed volume in traditional markets of Gulf, Europe, and North America. In fact, Pakistan has only been successful in maintaining market share by tapping non-traditional, middle-income markets such as African and Central Asian countries.
This brings us to two important conclusions: first, basmati export volume may struggle to maintain it previous year levels if prices escalate abnormally (as they seem to indicate so far). Two, price elasticity of demand may be significantly greater in non-traditional, low to middle income markets of Africa and Central Asia, compared to that in traditional markets such as Gulf and the West where demand is not only entrenched, but consumers also enjoy higher disposable income.
Afterall, harder for desi diaspora in Dubai to stop making pulao than for Kazakhs and Kenyans who have only recently discovered a taste for the delicacy. If rice exporters hope to grow export revenue despite the loss of coarse rice crop, they may have to fight to recapture traditional markets after all.


 as collateral: SBP unveils MFFs access mechanism for IBIs")


Comments
Comments are closed.