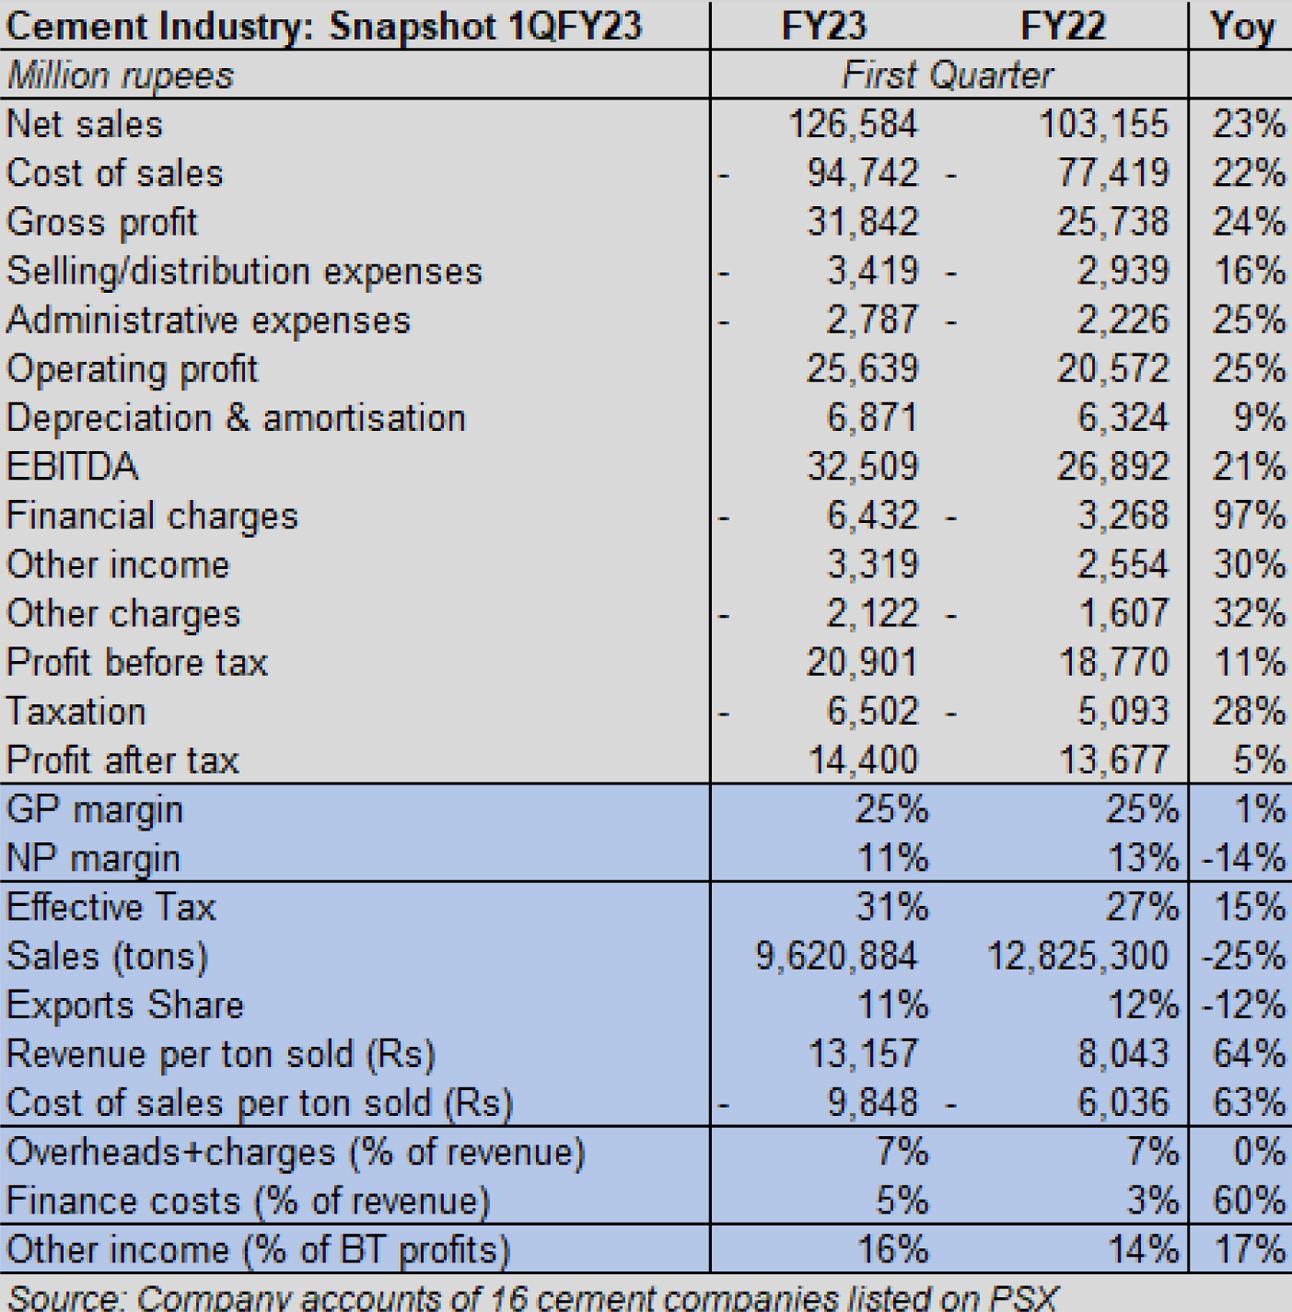
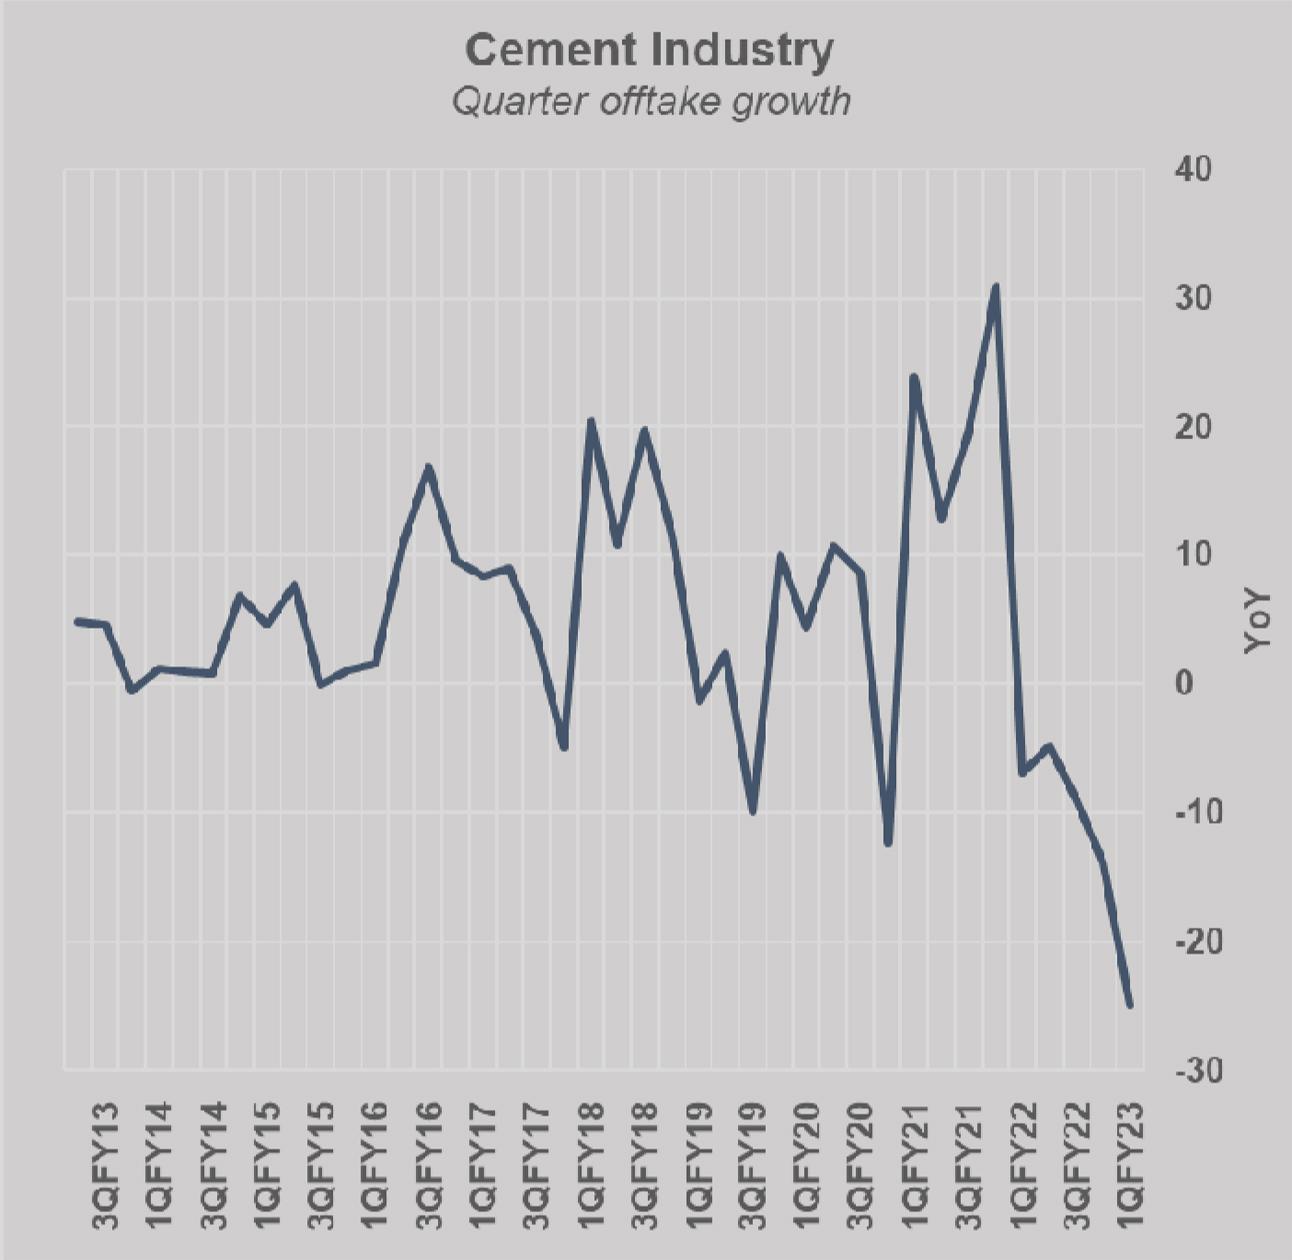
How does a 25 percent drop in offtake—which is the biggest drop the industry has witnessed in over a decade—translate to a cumulativepre-tax earnings growth of 11 percent? Here’s a hint: the answer starts with the letter p.
The industry is cement, the numbers belong to the latest quarter (1QFY23) and it’s all about prices.There is a reason why inflation is frighteningly high. Firms have been passing on more than their costs onto consumers. Though cement industry is certainly not the only one to raise prices over the past year, it is definitely a leading one, along with other construction materials manufacturers (such as steel).

Costs rose, and quite dramatically too. If the revenue per ton sold during 1QFY23 rose 64 percent—signifying the price hike effect—costs per ton sold also rose; slightly lower at 63 percent. Higher fuel prices, expensive coal in the global market, rupee depreciation; all have had an effect. Most cement manufacturers have been using a mix of domestically procured coal and Afghan coal to avoid the substantially expensive coalinkey global markets (read: “Cement: Coal buffers”, Nov 29, 2022). This has shielded their costs from spiralling out of control. But evidently, other cost factors did their job well.
Gross margins for the industry stand at 25 percent in 1QFY23, same as last year, despite the reduced demand in domestic and foreign markets. While overheads and other charges remained constant at 7 percent of revenue same as last year, finance costs due to rising interest rose ballooned from 3 percent of revenue to 5 percent in 1QFY23.

The industry earned sufficient “other income” to stop earnings from sliding. About 16 percent of before-tax earnings infact came from “other income” in 1QFY23, which was 14 percent last year. The effective tax for the industry was also higher at 31 percent, versus 27 percent in 1QFY22. This led to the post-tax bottom-line growth of 5 percent which should still be considered robust given the decline in volumes.
Now with international coal prices dropping, cement manufacturers can optimize their coal costs by prudent inventory management and demand estimation in order to secure margins. Prices are not expected to decline any time soon, much to the chagrin of builders and developers who have been crying fowl about the “cartelization” of cement manufacturers.
But demand would certainly be a factor going forward, lest the construction spending completely dries out due to inflation and cement firms are left with massive idle capacities. In 1QFY23, the industry is running on 67 percent capacity utilization compared to 89 percent this time last year. There is a lot to mull over.


Comments
Comments are closed.