

Headline inflation hits rock bottom — rising only 0.7 percent in March 2025 compared to 20.7 percent in the same period last year. This marks the lowest figure since December 1965. However, that doesn’t mean much in the current context. It’s just a number. The pace of decline in inflation mirrors the speed of its rise over the past couple of years, and overall prices are still, on average, 0.7 percent higher than they were a year ago.
There is no real relief for the struggling poor and the shrinking middle class, both of whom are still coping with a fall in purchasing power. It’s going to be a long, patient wait, especially given that the economy is growing slower than the population.
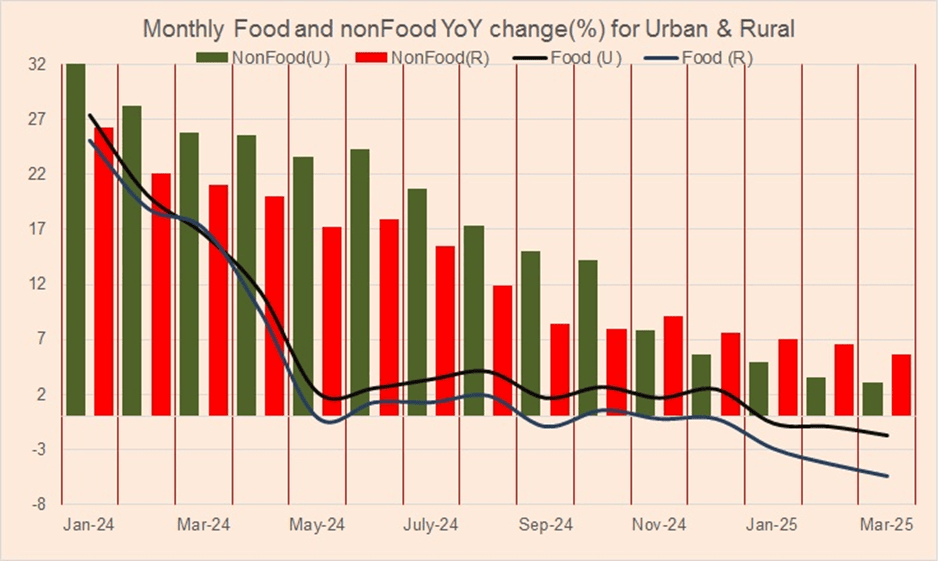
The decline in March inflation was expected, and the month-on-month increase of 0.9 percent is actually higher than the year-on-year increase — highlighting that this is primarily a high base effect story. The downward trend in inflation is not uniform: food and energy prices declined over the last year, with food inflation at minus 5.1 percent, and the housing, water, electricity, gas, and fuel index down by 2.2 percent. The transport sector also saw inflation drop by 1.2 percent.

The dip in food prices is due to depressed global rates and the absence of a wheat support price — wheat prices are down over 30 percent compared to the same period last year. This has serious consequences for the farm economy, which continues to struggle and is preventing a broader economic rebound, despite lower interest rates and relatively better performance in urban areas.
On the other hand, food prices rose 1.9 percent in March compared to the previous month, largely due to seasonal Ramzan demand for certain items. In urban areas, notable price increases were seen in tomatoes (up 36%), fresh fruits (up 18.7%), eggs (up 14.9%), sugar (up 11.5%), and chicken (up 10.9%). Still, even with these increases, year-on-year food inflation in March remained at minus 5.1 percent, and minus 0.9 percent for the first nine months of FY25.
For the urban middle class, the easing of inflation is not as significant as the headline figure suggests. Core inflation is edging up, registering a 9 percent increase in March. Several categories are firmly in double digits — education (11.9% in March, 11.7% for 9MFY25), health (13.8% in March, 14.5% for 9MFY25), and clothing and footwear (13.5% in March, 15.0% for 9MFY25).
These categories have a relatively low weight in the Consumer Price Index (CPI), which is why their impact on the headline number is limited. For instance, education has just a 3.8 percent weight in the CPI, though it represents a much higher share of spending for a typical young urban family. The same goes for health. In a country where education and healthcare are largely privatized, high inflation in these sectors disproportionately affects a youthful population.
Going forward, headline inflation is expected to bounce back from May onwards due to base effects, though April inflation is also likely to stay around 1 percent. The recent revision of electricity tariffs is expected to ease inflationary pressure somewhat, and any resurgence is likely to remain subdued.
However, this might not be enough to prompt the central bank to significantly ease monetary policy. Interest rates have already been cut by 1,000 basis points in under a year. The SBP may prefer to wait and observe the impact on demand — particularly whether it leads to higher imports and currency pressure. The SBP paused in its recent policy review and may maintain a wait-and-see approach until June.


Comments