

As the State Bank’s PMI climbed to a 28-month high in February, it seemed reasonable to expect some of that optimism to trickle into large-scale manufacturing. But LSM continues to ignore the signals, trudging on with another dismal performance. The 12-month moving average for February 2025 fell to a 30-month low, reinforcing the view that whatever recovery the economy is hoping for, large industries have yet to get the message.

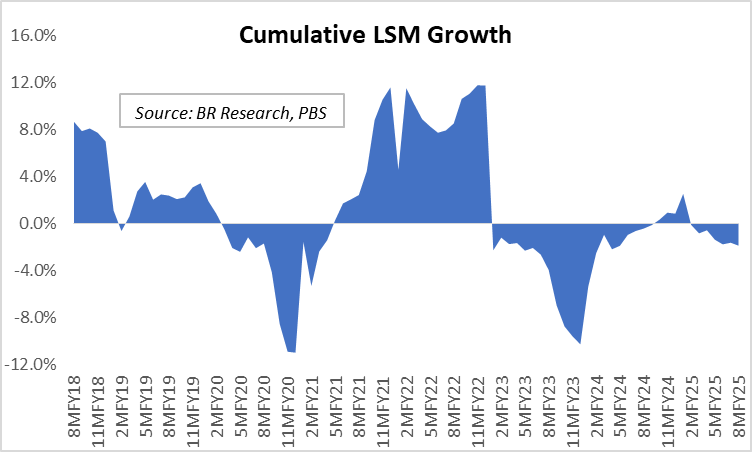
February marked the fourth straight month of negative LSM growth, down 3.5 percent year-on-year. That makes it six out of eight months in the current fiscal where the index has dipped into the red. Cumulative LSM growth for 8MFY25 now sits at negative 1.9 percent. It’s not just a bad run—it’s a structural malaise. Eight of the last ten quarters have seen contraction in LSM output, and unless March 2025 pulls off a remarkable rebound of over 5 percent, that number will stretch to nine out of eleven.

Perspective helps. The total industrial output from July to February this year is lower than it was in FY19. Eleven of the 22 tracked sub-sectors are now operating below the index levels recorded at the start of the base year almost a decade ago. That’s not a temporary shock. That’s regression. Some sectors may not return to those levels ever again.
The depth of decline is staggering. On a seasonally adjusted 12-month rolling basis, juices, leather goods, and motor tyres are all at a 105-month low. Cement has fallen to an 82-month low. Iron and steel production is down to levels last seen eight years ago. The list isn’t short, and the trend isn’t accidental.
Yet, not every corner of LSM is in retreat. Wearing apparel remains the standout performer, driven by record-high readymade garment exports. That single sector contributed nearly two-fifths of the positive LSM weight during the first eight months of the fiscal. Automobiles, predictably, are next in line, driven by an exaggerated base effect. Car production during 9MFY25 has grown 37 percent year-on-year, though the pace is showing signs of easing. Credit availability and price stability may keep the party going for a little while longer.
Textiles, meanwhile, remain trapped in a rut. Growth in cotton yarn and cotton cloth is still stuck under 2 percent, despite an extremely low base. The index value for the textile sector stood at 84 in December 2024, its 29th consecutive month below the 100 mark. That’s a long way from the 115 peak in April 2022.

Elsewhere, pharmaceuticals have held their ground, but barely. Growth has slowed to a crawl at just 2 percent. Construction-linked industries—cement, glass, steel, paints, and wood—are all underperforming, with little sign that the ongoing interest rate reversal has made any meaningful dent. The white goods category continues to flatline, as electrical equipment production—from refrigerators to TVs to air conditioners—remains well below average.
It may not be a lost cause just yet. A meaningful downward revision in industrial electricity tariffs has already been announced, and further adjustments may be on the way. Cheaper energy and improved credit conditions could offer some cushion in the final quarter of FY25. But make no mistake—there’s a long road ahead. Even an optimistic end to the year would still leave LSM well below pre-contraction levels. The slumber, for now, continues.


Comments