BML 4.92 Increased By ▲ 0.01 (0.2%)
BOP 14.49 Increased By ▲ 0.17 (1.19%)
CNERGY 7.02 Decreased By ▼ -0.04 (-0.57%)
CPHL 88.50 Increased By ▲ 0.31 (0.35%)
DCL 12.63 Increased By ▲ 0.19 (1.53%)
DGKC 192.50 Increased By ▲ 8.22 (4.46%)
FCCL 50.45 Increased By ▲ 0.45 (0.9%)
FFL 15.82 Increased By ▲ 0.13 (0.83%)
GCIL 27.96 Decreased By ▼ -0.40 (-1.41%)
HUBC 160.50 Increased By ▲ 1.65 (1.04%)
KEL 5.18 Increased By ▲ 0.12 (2.37%)
KOSM 6.35 Increased By ▲ 0.05 (0.79%)
LOTCHEM 21.99 Increased By ▲ 0.18 (0.83%)
MLCF 89.75 Increased By ▲ 3.80 (4.42%)
NBP 147.01 Increased By ▲ 0.14 (0.1%)
PAEL 42.89 Increased By ▲ 0.32 (0.75%)
PIAHCLA 20.00 Decreased By ▼ -0.20 (-0.99%)
PIBTL 10.22 Decreased By ▼ -0.01 (-0.1%)
POWER 14.89 Increased By ▲ 0.32 (2.2%)
PPL 184.09 Increased By ▲ 4.65 (2.59%)
PREMA 42.86 Increased By ▲ 3.90 (10.01%)
PRL 31.46 Decreased By ▼ -0.20 (-0.63%)
PTC 23.27 Increased By ▲ 0.32 (1.39%)
SNGP 118.70 Increased By ▲ 1.67 (1.43%)
SSGC 41.38 Decreased By ▼ -0.39 (-0.93%)
TELE 7.75 Increased By ▲ 0.10 (1.31%)
TPLP 9.74 Decreased By ▼ -0.03 (-0.31%)
TREET 22.52 Increased By ▲ 0.08 (0.36%)
TRG 56.85 Increased By ▲ 0.52 (0.92%)
WTL 1.40 Decreased By ▼ -0.01 (-0.71%)
BR100 15,103 Increased By 140.9 (0.94%)
BR30 42,619 Increased By 540.8 (1.29%)
KSE100 148,196 Increased By 1704.8 (1.16%)
KSE30 45,271 Increased By 438.2 (0.98%)

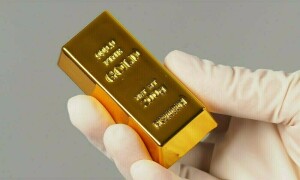
Output of gold in Australia, the world's No 2 producer, rose to its highest in a decade in 2013 as richer ores were mined to combat weak bullion prices, a survey released on Sunday showed. The practice, known as high-grading, caused output to jump by 7 percent, or 18 tonnes, to 273 tonnes (8.8 million ounces) last year, worth about $9 billion and the highest since mid-2003, according to a tally by Melbourne-based consultant Surbition Associates.
"The 2013 total gold output of 273 tonnes is the highest annual figure since 2003," said Dr Sandra Close, a Surbiton director. "Producers are responding to lower gold prices by treating less low grade material and this results in higher output and reduced costs."
The downside in processing higher-grade ore is that some lower grade ore that was economic to treat at higher prices is no longer profitable, Close said, suggesting output could go down once the richer material is mined out.
Rising bullion prices in 12 of the past 13 years made lower-grade ore profitable to extract, allowing miners to expand their reserves. But a 28 percent decline in the price of gold in 2013 to just above $1,200 at year-end means that mining some of those reserves would no longer pay off. Gold was quoted at $1,327 an ounce on Sunday.
In Australian dollars, bullion fell only 16 percent to around
A$1,345 per ounce, owing to a decline in the Australian dollar.
Since January 2014, Australian dollar gold prices have increased by 11 percent to around A$1,485 per ounce. Higher output from mines operated by AngloGold Ashanti Ltd
and Newcrest Mining Ltd in 2013 more than offset declines from ones owned by Barrick Gold Corp
and Newmont Mining Corp, including the 50-50 Super Pit joint venture, once Australia's biggest mine. Newmont's wholly owned Boddington mine, some 700 km (400 miles) away, is currently Australia's biggest gold mine.
Despite the increase in 2013, Australia remains a distant second to China, which produced around 430 tonnes in 2013, based on industry estimates.

Copyright Reuters, 2014

Comments

Comments are closed.