BML 5.62 Decreased By ▼ -0.03 (-0.53%)
BOP 16.58 Increased By ▲ 1.51 (10.02%)
CNERGY 7.25 Increased By ▲ 0.03 (0.42%)
CPHL 93.02 Increased By ▲ 3.63 (4.06%)
DCL 13.85 Increased By ▲ 0.22 (1.61%)
DGKC 209.22 Increased By ▲ 1.75 (0.84%)
FCCL 59.46 Increased By ▲ 4.09 (7.39%)
FFL 17.13 Increased By ▲ 0.36 (2.15%)
GCIL 28.44 Increased By ▲ 0.33 (1.17%)
HUBC 163.93 Decreased By ▼ -0.34 (-0.21%)
KEL 5.43 Increased By ▲ 0.11 (2.07%)
KOSM 6.92 Increased By ▲ 0.21 (3.13%)
LOTCHEM 22.00 Increased By ▲ 0.05 (0.23%)
MLCF 104.83 Increased By ▲ 2.15 (2.09%)
NBP 153.50 Increased By ▲ 5.07 (3.42%)
PAEL 52.54 Increased By ▲ 4.78 (10.01%)
PIAHCLA 19.75 Increased By ▲ 0.23 (1.18%)
PIBTL 12.96 Increased By ▲ 0.17 (1.33%)
POWER 17.41 Increased By ▲ 0.41 (2.41%)
PPL 179.12 Increased By ▲ 1.81 (1.02%)
PREMA 41.78 Increased By ▲ 1.62 (4.03%)
PRL 31.71 Increased By ▲ 1.08 (3.53%)
PTC 22.77 Decreased By ▼ -0.03 (-0.13%)
SNGP 114.92 Increased By ▲ 0.33 (0.29%)
SSGC 40.78 Increased By ▲ 0.76 (1.9%)
TELE 8.14 Increased By ▲ 0.05 (0.62%)
TPLP 10.30 Increased By ▲ 0.11 (1.08%)
TREET 25.01 Increased By ▲ 1.29 (5.44%)
TRG 56.51 Decreased By ▼ -0.60 (-1.05%)
WTL 1.44 Decreased By ▼ -0.01 (-0.69%)
BR100 15,235 Increased By 150.4 (1%)
BR30 44,824 Increased By 812 (1.85%)
KSE100 149,971 Increased By 1353.3 (0.91%)
KSE30 45,655 Increased By 407.2 (0.9%)

US farmers will plant 90.0 million acres of soyabeans this spring, down from 90.1 million last year, and reduce corn acres to 90.0 million acres from 90.2 million in 2017, the US Department of Agriculture projected on Thursday.
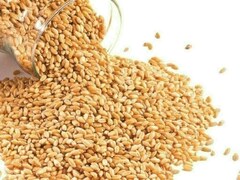
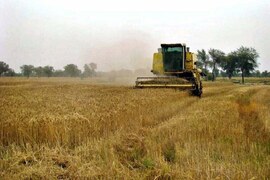
The USDA at its annual Agricultural Outlook Forum projected US wheat plantings for 2018 at 46.5 million acres, up from 46.0 million a year earlier. A Reuters poll of analysts estimated that soyabean plantings would rise to 90.6 million acres and corn seedings would drop to 89.9 million acres. Some analysts were surprised that the government projected a drop in soyabean acres. The price ratio between new-crop November soyabean futures and December corn futures on the Chicago Board of Trade is near 2.6-to-1, high enough to encourage farmers to plant more soyabeans than corn.
"Going forward, we should see 2018 soyabean area estimates about 0.5-1.0 million acres above USDA's 90.0 million, if the current November soyabean/December corn ratio relationship holds," said Terry Reilly, senior analyst with Futures International. "In March, we look for the corn area to be reported 1-2 million below USDA's 90.0 projection," Reilly added. The USDA is scheduled to release an annual planting intentions report, based on a survey of producers, on March 29.
Soyabeans are generally less expensive to plant than corn, which requires more fertilizer. "The farm economy is still struggling, and soyabeans are a 'low-cost' crop to plant, cutting producer risk, and more importantly, the banker risk," said Dale Durchholz, senior market analyst with AgriVisor. In Illinois, the top US soya producer and No. 2 corn grower, soyabeans have been more profitable than corn every year after 2012, according to University of Illinois agricultural economist Gary Schnitkey.

Copyright Reuters, 2018

Comments

Comments are closed.