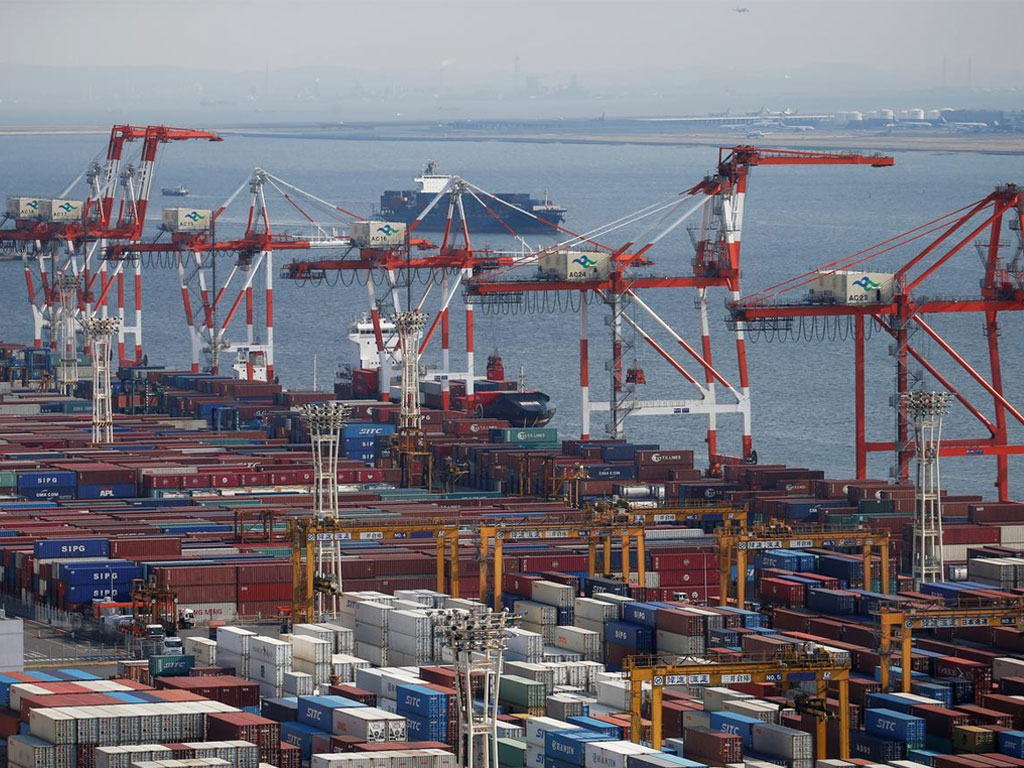
 The country's exports have posted a growth of 3.21 percent during first half (July-December) of current fiscal year. According to provisional foreign trade data, exports stood at $11.540 billion during this period against $11.181 billion in corresponding period of 2018-19, showing $359 million (3.21 per cent) increase.
However, imports contracted by 17.06 percent from $27.952 billion during first half of current fiscal year to $23.182 billion. The foreign trade figures show that trade balance which was $16.771 billion during first half of last fiscal year, has now reduced to $11.642 billion. The trade difference of $5.129 billion has been recorded during the period.
The data further indicates that exports of cotton yarn declined by 1 percent, cotton cloth 3 percent, cement 7 percent, sugar 11 percent, leather tanned 19 percent, tents, canvas & tarpaulin by 20 percent, petroleum crude 24 percent, gloves 25 percent, oil seeds, nuts and kernels 56 percent, petroleum products 72 percent, wheat 88 percent and molasses by 98 percent.
The products which posted growth in exports were as follows, Basmati rice 56 percent, meat 52 percent, vegetables 41 percent, fish/sea food 23 percent, rice of other varieties 14 percent, artificial skills & synthetic textile 13 percent, footballs 13 percent, leather footwear 13 per cent, readymade garments 12 percent, leather gloves 11 percent, surgical/medical instruments 10 percent, knitwear 8 percent and bed wear 3 percent.
Top declining imports were CBU motor cars by 80 percent, CBU buses, trucks 51 percent, transport parts 47 percent, CKD motor cars 46 percent, fertiliser manufactured 33 percent, iron and steel 32 percent, petroleum crude 30 percent, petroleum products 24 percent, plastic material 12 percent, palm oil 10 percent, and LNG 5 percent.
According to trade data top growing imports were mobile phone by 69 percent, electrical machinery and apparatus by 48 percent, aircraft, ships and boats 47 percent, LPG 34 percent, iron and steel scrap 5 percent, spices 5 percent, warm clothing 3 percent and rubber crude etc. 2 percent.


Comments
Comments are closed.