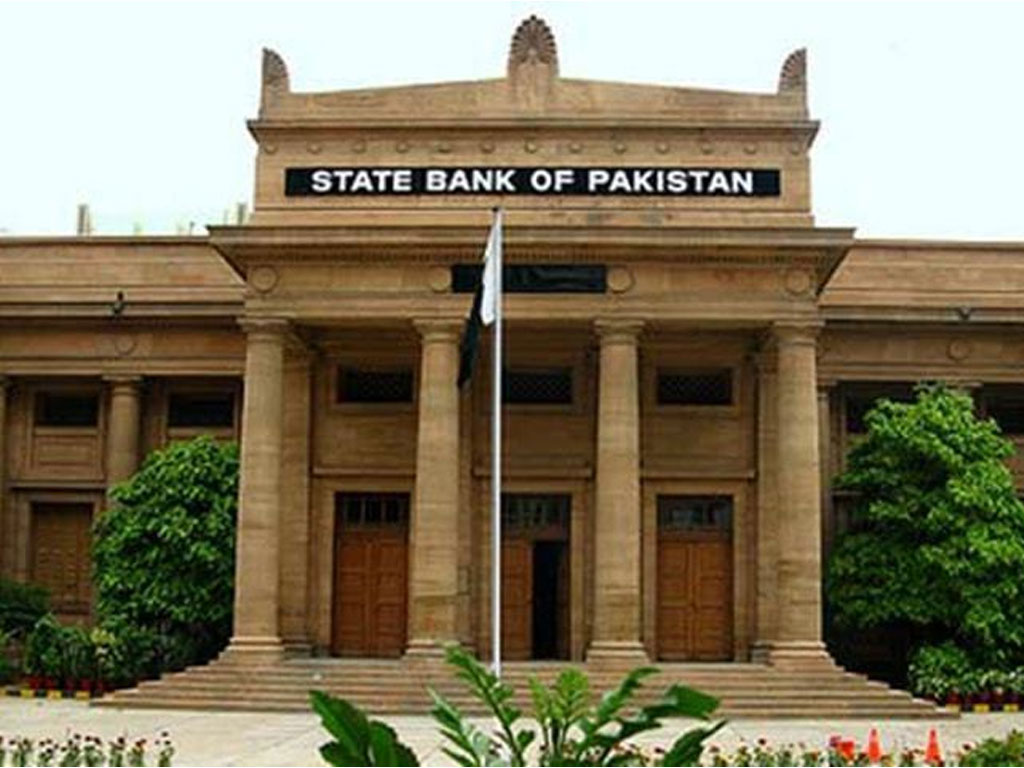
 The pace of domestic debt accumulation accelerated sharply to Rs 1.9 trillion during the first quarter (Jul-Sep) of this fiscal year (FY20). The increase was almost four times higher than in Q1FY19.
According to State Bank of Pakistan's first quarterly report "The State of Pakistan's Economy", although the financing needs were lower than last year, the government continued to build up strategic cash buffers in the form of deposit accumulation and the need for these cash buffers emerged as the government adhered to zero fresh borrowing from the central bank. These deposits would facilitate the government to manage its debt obligations more smoothly in the absence of a major source of financing.
The report said that the maturity structure of the additional domestic debt was almost equally balanced between short-term and long-term securities during Q1-FY20. It is important to highlight that the overall share of short-term debt has declined substantially since June 2019, when the government re-profiled its short-term debt into long-term debt. Consequently, the re-pricing and roll-over risks have also significantly declined.
The government's borrowing from non-bank sources amounted to Rs 342.8 billion in Q1-FY20, compared to Rs 242.0 billion during the same period last year. Non-banks preferred investing in T-bills and also PIBs.
Net mobilization from National Saving Schemes (NSS) also increased significantly during the period under review, due to higher profit rates and some possible switchover from the discontinued Rs 40,000 denomination prize bonds towards various NSS instruments.13
According to report, public debt increased by Rs 1.5 trillion during Q1-FY20, as compared to an increase of Rs 0.8 trillion in the same period last year. This rise was mainly attributed to an increase in the domestic debt, which more than offset the decline in the rupee value of external debt.


Comments
Comments are closed.