Sanofi Aventis Pakistan Limited


Sanofi Aventis Pakistan Limited (PSX: SAPL) was established in Pakistan in 1967 as Hoechst Pakistan, manufacturer of pharmaceuticals and specialty chemicals. After a number of changes of business, mergers and acquisitions, it stands today as Sanofi-Aventis Pakistan Limited. Sanofi is a subsidiary of Sanofi Foreign Participations B.V. (the parent company), registered in Netherlands. Sanofi S.A. France is the ultimate parent company, with a shareholding of nearly 53 percent.
Its manufacturing facility is divided into four business units: Claforan plant for online filling and packing of sterile powder; Haemaccel plant, a blood plasma substitute facility: Solids manufacturing unit and oral liquid manufacturing plant.
Shareholding Pattern
A large chunk i.e. 74 percent of the shares is with the associated companies, undertakings and related parties. Of this 71 percent is with the parent company, Sanofi Foreign Participations B.V. The directors, CEO, their spouses and minor children own close to 14 percent of which 61 percent is with Mr. Arshad Ali Gohar, a non-executive director. The remaining about 16 percent is with the remainder of the categories.
Historical operational performance
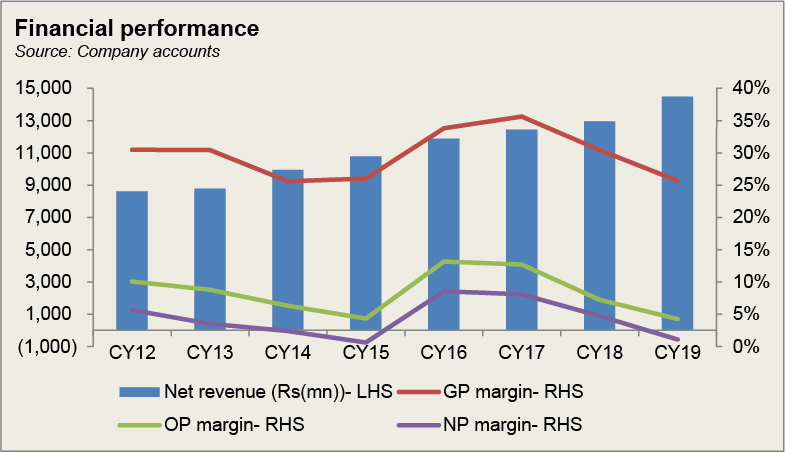
Although Sanofi Aventis’ topline has been growing at varying rates consistently, profit margins of the company have declined twice since CY12; once in CY15 and again recently in CY19.
During CY15, Sanofi grew its topline by a little over 8 percent which came primarily from pharmaceutical, vaccine and consumer healthcare (CHC) products. The vaccine sales in particular registered a growth of 51 percent while generally a growth in vaccine business, public and private was seen in the economy. Although gross margins remained flat relative to that seen in CY14, operating margin saw a decline owing to the distribution cost taking up 20 percent of the topline. Additionally, other income also reduced notably due to exchange rate, eliminating the otherwise significant income arising out of exchange gain. Distribution cost was higher due to higher personnel costs combined with freight and transportation costs, thereby reducing net profit margin to less than 1 percent (CY14: 2.4%).

In CY16 Sanofi experienced double digit topline growth at 10 percent attributable to both, better volumes and prices. More importantly, the company managed to significantly reduce its cost of manufacturing as a percentage of revenue. A notable reduction was seen in the cost of raw material consumed. Note that majority of the pharmaceutical companies in the country rely on imported raw materials. Sanofi is no exception. With exchange rate remaining stable throughout the year, the impact was seen in form of lower costs. In the previous year, currency weakened in the second half of the year. Distribution expense also saw a year on year decline as last year’s restructuring costs were a one off expense, not seen in CY16. Thus operating and net profit margins reached their highest level.
Topline growth was lower than that seen in the last two years- at close to 5 percent. A key contributor to better sales has been the core business, that is, the established brands, which made up 40 percent of the sales. Of this Flagyl, a well known product contributed 16 percent. Cost of manufacturing further reduced to consuming 64 percent of the revenue, thus improving gross margins. Distribution costs remained unchanged but administrative costs increased due to staff costs. Note that more than 50 percent of the total employees are in the sales division. Finance costs also reduced considerably as the company acquired a loan in July 2013 which had to be paid off in three years’ time, thus absent in CY17. Other expenses were largely driven by exchange loss as rupee weakened, more so in the second half of the year. Thus margins reduced slightly.

Lower topline growth continued during CY18. The company’s Pharmaceutical segment which contributes 80 percent to the revenue, grew by 7.7 percent. However, the growth here was offset by a drastic decline in the vaccines segment, primarily due the government business which reduced from Rs 633 million in CY17 to Rs 17 million in CY18. Moreover, cost of manufacturing also consumed 70 percent due to currency devaluation. The resultant exchange loss also elevated other expenses, thus profit margins for the year were halved relative to CY17.

In CY19, Sanofi was able to regain momentum as its topline grew by almost 12 percent. Its star product Flagyl, which has consistently contributed around 20 percent to sales, grew by a noteworthy 26 percent, while the pharmaceutical segment on the whole registered a 12 percent growth. Costs further inclined due to currency devaluation which was quite significant throughout CY19. The company is not only reliant on imports of raw materials, but also finished goods, which exposes it to the risk associated with exchange rate fluctuations. The effect of high cost of manufacturing trickled down to the bottomline.

Quarterly results and future outlook
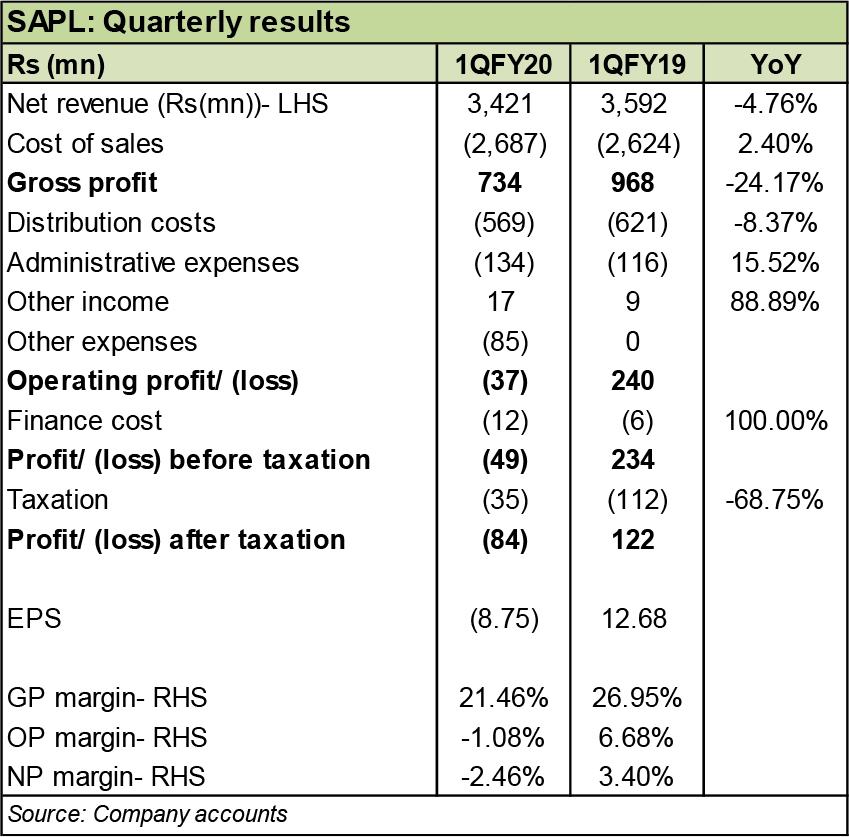
The effect of the ongoing pandemic is quite visible in the financials of Sanofi’s first quarter results for CY20. Topline fell by around 5 percent as Covid-19 hit Pakistan around February. Cost of manufacturing rose as a percentage of revenue due to currency devaluation specifically in the second week of March. Distribution costs fell since the promotional activities were put on a halt due to the lock down. The 16 percent devaluation from March 2019 to March 2020 gave rise to exchange losses hence the much higher other expenses year-on-year. Thus the quarter ended in a loss.
The pharmaceutical sector of the economy struggles with intense price controls despite inflation and currency devaluation which affects cost of procuring raw materials. The chemical sector of the economy does not have the capacity to cater to the requirements thus making the pharmaceutical sector dependent on imports. Moreover, the sector also faces the menace of counterfeit products. With a growing population of Pakistan, of which more than 7 million are diabetic, the need for investment and research and development in the health sector is of prime importance.


Comments
Comments are closed.